LinkedIn engagement rate demystified + benchmark
Is there a single number that tells you exactly how well you’re performing on LinkedIn? In this article, we look at the various metrics used to measure success and dive deep into the one value that combines them all: LinkedIn engagement rate. We explain why we use the LinkedIn engagement rate, how it is measured, and finally address the frequently asked question: “What is a good engagement rate?”
How do you know if a LinkedIn post is working?
LinkedIn is the social media platform where the focus lies on careers and business, making it a vital channel for your content distribution. But how do you know if your posts are actually being seen and if the content you share resonates with your (potential) customers?
The number of impressions, clicks, comments, and the CTR (Click-Through Rate) are all valuable metrics to monitor. However, one post might get many comments while another drives more clicks—how do you ensure you are comparing apples to apples?
Fortunately, there is one value that combines all of this: the LinkedIn engagement rate. The advantage of using a single figure is that it effectively displays the overall trend. With the engagement rate, fluctuations in individual factors have less impact; the focus stays on the combined engagement you generate from day to day.
Do you want to know which type of post generates more comments? Or which content drives people to your website? In those cases, it is obviously better to look at individual metrics. That is why our digital marketing dashboard always features a combination of all these factors. And while the engagement rate is a single figure designed to make things simpler, it is also abstract and often raises questions. After all, what actually constitutes a “good” engagement rate?
LinkedIn engagement rate
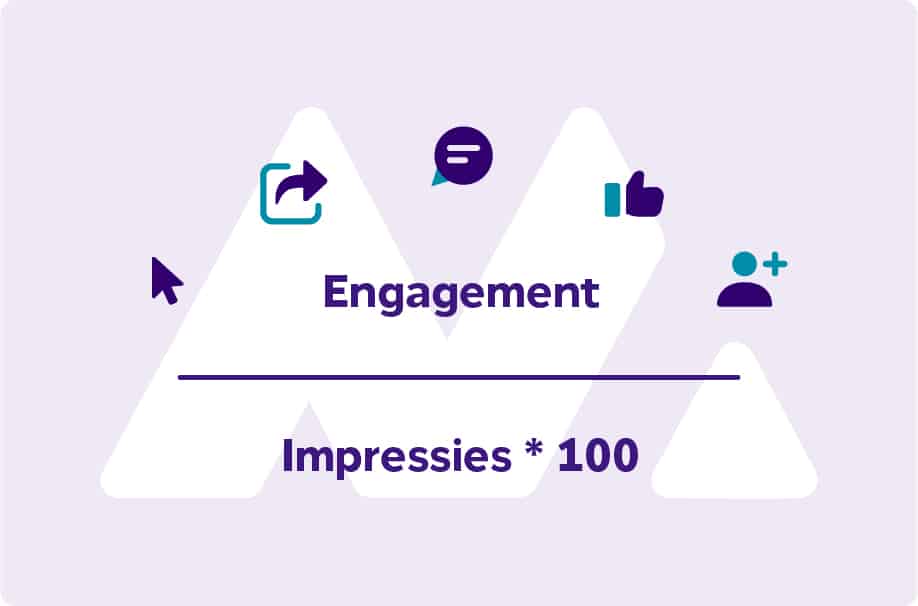
Before we answer that question, let’s dive into the LinkedIn engagement rate itself. LinkedIn only provides this percentage per individual post and unfortunately does not show how your company page scores as a whole. However, that is exactly what we want to know, as we include this in our monthly digital marketing dashboards. So, we did the math! LinkedIn calculates its engagement rate per post as follows:
(Clicks + Likes + Comments + Shares + New Followers) / Impressions * 100
We apply this same formula to measure the engagement rate of an entire company page. It’s a great tool for seeing at a glance how your business profile is performing.
What is a good LinkedIn engagement rate?
Opinions vary on this, but a quick search of Google results gives us a general baseline. Generally, an engagement rate between 1% and 5% is considered a good result for LinkedIn. However, many sources cite 2% as the standard benchmark, viewing anything above that as a success.
In our experience, the engagement rate in niche markets (such as many B2B sectors) can actually be significantly higher. We aren’t surprised by engagement rates between 3% and 6%, and we regularly see outliers that go even higher.
Would you like to know more about leveraging LinkedIn for your company? We would love to start a conversation with you about the organic and paid opportunities on LinkedIn! Want to keep reading? We’ve gathered all our insights on our LinkedIn advertising page.