LinkedIn Advertising Benchmark 2026: Results per € 1,000
What does €1,000 buy you on LinkedIn in 2026? Across every campaign type, the same budget now buys substantially less than it did two years ago. In this article, we’ll dive into the exact changes and, of course, discuss what it means for you as an advertiser.
Let’s be clear upfront though: LinkedIn is still an excellent platform for B2B advertising. No other paid channel offers the same combination of professional targeting and senior audience reach. But running campaigns effectively in 2026 requires recalibrated expectations. That’s what this article is for.
The question every advertiser asks
Before launching a LinkedIn advertising campaign, the most important question is rarely about targeting parameters or creative formats. It is simpler than that: what will I actually get for my budget? How many people will see my ad, how many will click, and — if I am running lead generation — how many leads can I realistically expect?
This article answers that question with data from the campaigns we ran across our B2B clients in Western Europe throughout 2025. We present the results per €1,000 of spend for each campaign objective, alongside a direct comparison with our 2023/24 benchmark — because understanding the change is as important as knowing the current numbers.
The short version: the same budget now buys substantially less than it did two years ago. CPM has roughly doubled or tripled depending on the objective, CTR has declined for website visits, and the cost per lead has risen. This does not mean LinkedIn Advertising is less relevant as a channel, but it does mean expectations need to be recalibrated.
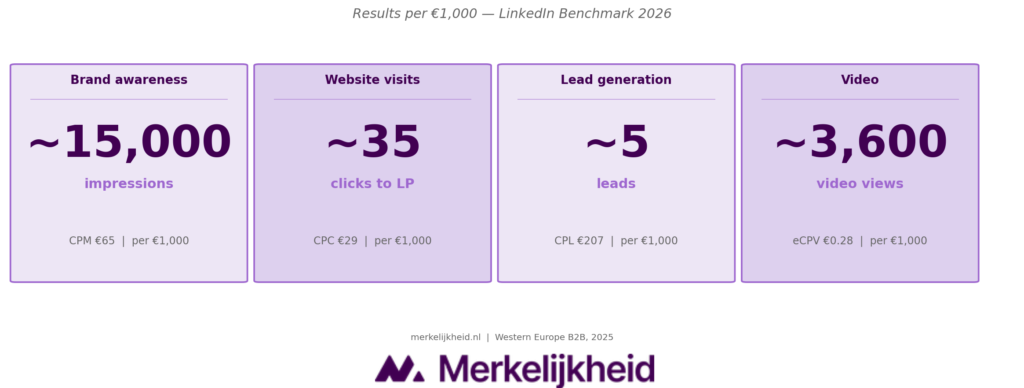
Results per €1,000 at a glance
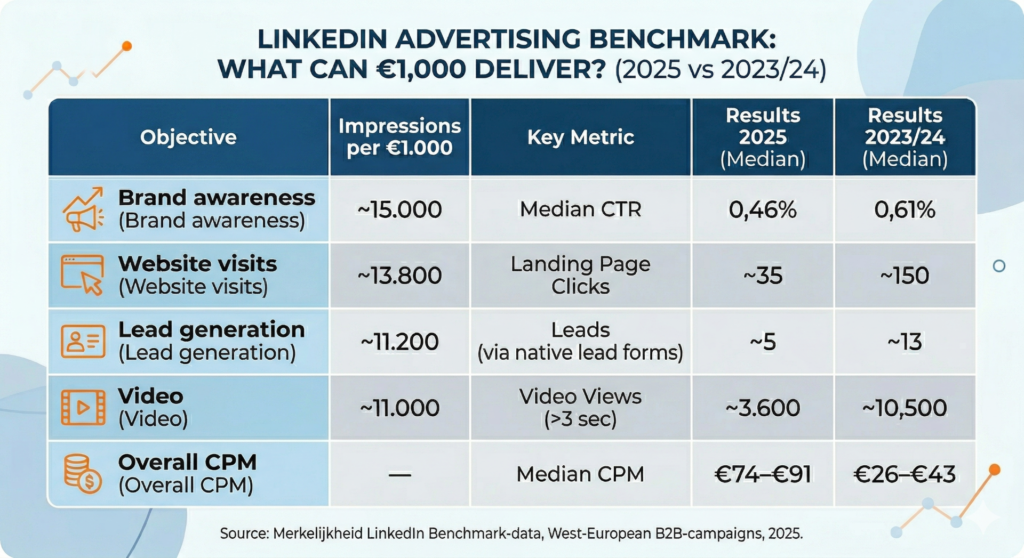
The table below summarises what a €1,000 budget can expect to deliver across each campaign objective in 2025, based on median campaign performance:
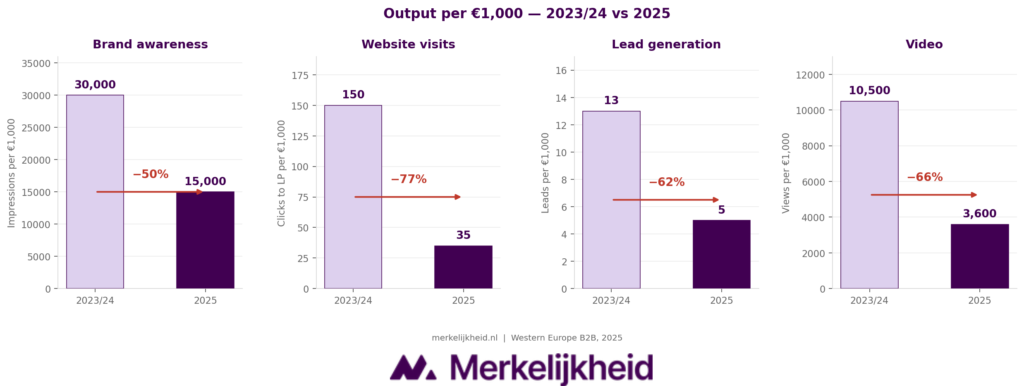
To emphasize, this is how much it’s changed in a relatively short time:
Brand awareness
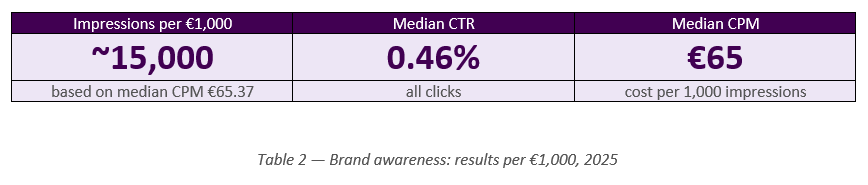
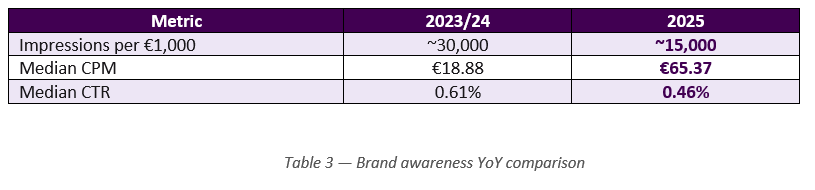
Brand awareness campaigns are bought on impressions. With a median CPM of €65.37, a €1,000 budget delivers approximately 15,000 impressions — the number of times your ad is shown to members of your target audience. In 2023/24, that same budget typically produced around 30,000 impressions at an average CPM of around €32. The platform now costs twice as much to reach the same number of people.
The median CTR of 0.46% means that roughly 69 of those 15,000 impressions result in a click of some kind — including clicks to your LinkedIn company page, follows, and other engagement actions. Only about one in five of those clicks goes to your landing page, so the actual number of website visits generated by a brand awareness campaign is lower than the CTR suggests. For reach and visibility objectives, this is expected behaviour.
Despite the cost increase, brand awareness remains the most efficient format for generating raw impressions. The CPM is the lowest of all objectives, and the high reach makes it particularly suited to audience warming — building familiarity with your brand before presenting a more direct offer. For advertisers with longer sales cycles or a new proposition, consistent brand awareness investment continues to lay the foundation for downstream conversion.
Website visits
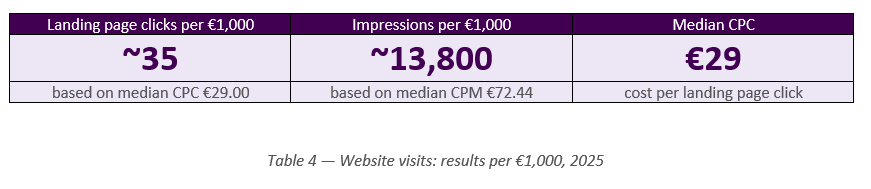
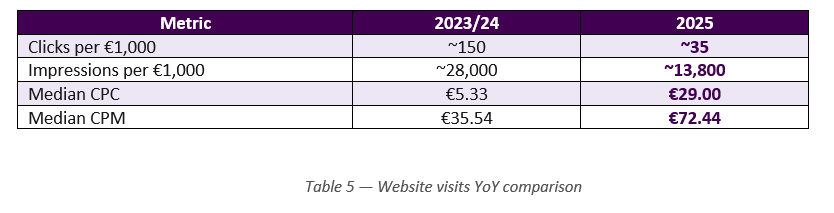
Website visits is the campaign type that has changed most dramatically. In 2023/24, a €1,000 budget typically produced around 150 clicks to the landing page. In 2025, the same budget delivers approximately 35 clicks — a reduction of more than 75%.
This is the combined result of two forces moving against advertisers simultaneously. The median CPM rose from €35.54 to €72.44 (+104%), meaning each impression costs roughly twice as much. At the same time, the median CTR dropped from 0.69% to 0.27% (−61%), meaning far fewer of those impressions produce a click. When CPM doubles and CTR halves, CPC does not double — it nearly quintuples. The median CPC for website visits went from €5.33 in 2023/24 to €29.00 in 2025.
The practical implication is significant. If a website visit used to justify a €5–7 cost on LinkedIn, the question now is whether it justifies €29. For companies with strong downstream conversion rates — where a LinkedIn visitor is meaningfully more likely to become a customer than traffic from other channels — the answer may still be yes. But it requires honest evaluation of your funnel metrics, not an assumption carried over from previous years.
It also raises the importance of landing page performance. Fewer clicks arriving at a poorly converting page is a far more expensive problem in 2025 than it was in 2023. Every visit now costs more — which makes what happens after the click more consequential.
Lead generation
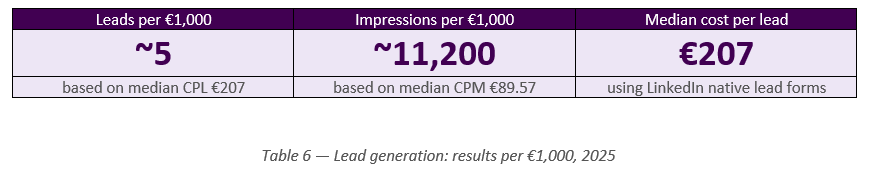
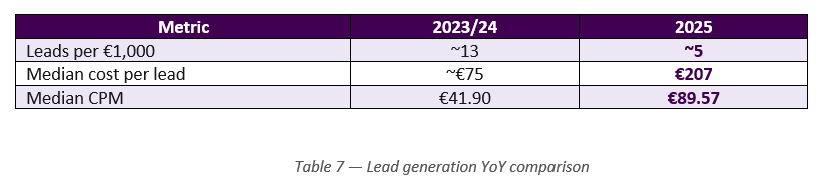
Lead generation on LinkedIn in 2025 produces approximately 5 leads per €1,000 of spend at the median, at a cost of €207 per lead. In 2023/24, the same budget typically yielded around 13 leads. The cost per lead has roughly tripled.
This increase reflects both the CPM rise (+114% for lead generation) and the higher competitive environment for the decision-maker audiences that lead generation campaigns typically target. When every impression costs more, the cost of generating a conversion rises proportionally — unless the lead form completion rate improves to compensate.
A cost per lead of €207 needs to be assessed in the context of what LinkedIn leads are worth. For B2B companies selling complex, high-value solutions, a qualified lead from a senior decision-maker at a target account can easily justify this cost — particularly when compared to the fully-loaded cost of other demand generation channels. For companies with shorter sales cycles or lower deal values, the economics require more careful scrutiny.
We generate almost all of our leads using LinkedIn native lead forms rather than directing people to an external landing page. In our experience, this consistently produces higher completion rates — the friction of leaving LinkedIn and filling in a separate form is removed, and the fields are often pre-populated from the member’s profile. If you are currently using a landing page approach for lead generation on LinkedIn, testing native lead forms is the single change most likely to improve your cost per lead without changing anything else.
Results vary significantly by market and proposition. Niche, high-intent audiences with a closely matched offer can produce lower CPLs than the median. Campaigns targeting broader or more general audiences typically see higher CPLs. The €207 median is a planning benchmark, not a guarantee.
Video
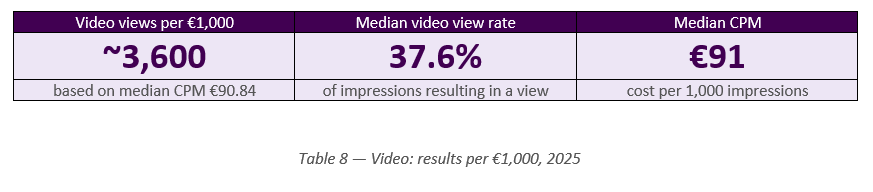
Video campaigns in 2025 deliver approximately 3,600 video views per €1,000 of spend, alongside around 11,000 impressions. LinkedIn counts a view when someone watches longer than 3 seconds, activates full screen, or plays audio — a relatively low threshold that reflects how video is typically consumed in a feed environment.
The headline story for video in 2025 is the CPM. In 2024, video CPM (€24.14) was the lowest of all campaign types — making it a cost-efficient format for reach. In 2025, video CPM has risen to €90.84, broadly in line with lead generation and above website visits. Video has lost its cost advantage as a reach format.
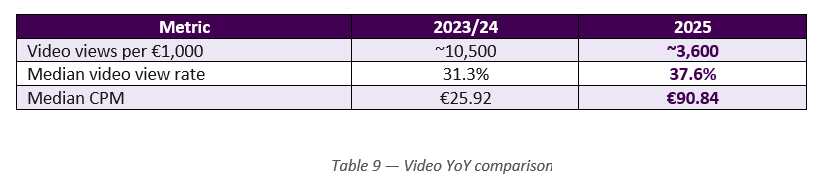
What has not changed is engagement. The median video view rate actually improved slightly, from 31.3% in 2024 to 37.6% in 2025 — meaning more than one in three people who see a video ad now watch it. This is a strong signal of genuine audience engagement, and it is what makes video valuable as an awareness and trust-building format, particularly for colder audiences who are not yet familiar with your brand.
For best results with video, keep content short — ideally under sixty seconds — and ensure the first three seconds are compelling enough to stop a scroll. The viewer view rate measures initial engagement, but completion data shows that significant drop-off occurs beyond the opening of the video.
What the change means in practice
Across every campaign type, the 2025 benchmark tells the same story: more expensive, with fewer outputs per euro of spend. It is worth being direct about what this means for how you plan and evaluate campaigns.
- Historical expectations are outdated. Benchmarks from 2022, 2023, or even 2024 are no longer reliable planning inputs. A campaign that was considered efficient two years ago may look expensive by the same standards today — even though nothing in the campaign itself has changed.
- Budget conversations need updating. The same budget now produces roughly half the reach, fewer clicks, and fewer leads than it did in 2023/24. If you are presenting results to stakeholders, this context is essential — raw numbers will appear to have declined even when campaign quality has not.
- Creative and conversion rate carry more weight. Because each impression, click, and lead costs more, the quality of what you do with them matters more. Creative that generates a higher CTR directly reduces your CPC. A landing page with a higher conversion rate directly reduces your CPL. The downstream performance of your funnel has more leverage than it did when costs were lower.
The value of LinkedIn audiences has not changed. Despite the cost increase, LinkedIn remains the most effective paid channel for reaching senior B2B decision-makers at scale. The value of a qualified lead from a director or VP at a target account has not declined — only the price of generating it has risen. For companies where LinkedIn leads convert meaningfully, the economics still hold.