LinkedIn Advertising Benchmark 2025
Are you ready to take your LinkedIn Ads to the next level? As you take your first steps into a LinkedIn Advertising campaign, you’re likely wondering: what results can I actually expect? We’re here to answer that, based on our updated LinkedIn Benchmark—which now, for the first time, includes data from video campaigns. Analyzing nearly two hundred campaigns across various B2B sectors, we’ll guide you through the world of LinkedIn Advertising: from CPM and CPC to CTR, engagement rate, and more.
We primarily work with B2B companies active in Western Europe. Most of these brands use LinkedIn Advertising to acquire new customers, while a minority use it to stay top-of-mind with existing relationships. In our experience, a LinkedIn Advertising strategy built on three distinct campaign stages—Brand Awareness, Website Traffic, and Lead Generation—delivers the best results and the highest volume of leads. We also frequently deploy video campaigns to support awareness and lead gen efforts. In this article, we break down the KPIs for each of these phases.
This benchmark utilizes all the data we gathered in 2024 to help you set your expectations for LinkedIn Advertising in 2025.
CTR LinkedIn benchmark
What percentage of your impressions results in a click? This is the Click-Through Rate (CTR), and it’s a KPI we monitor in every campaign. CTR indicates the level of interest in your topic, product, or service when paired with your creative. A high CTR is a strong signal; a low CTR prompts us to ask whether the ad creative is engaging or if the content itself needs refining. But to judge that, you need to know what “normal” looks like.
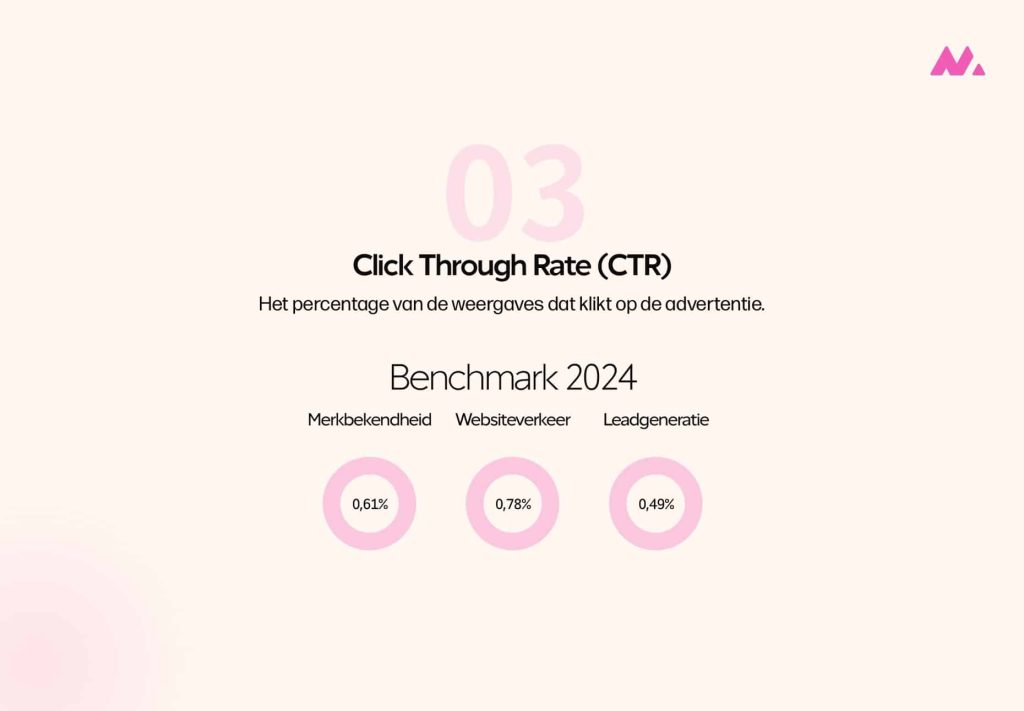
In the awareness phase, our LinkedIn campaigns see an average CTR of 0.61%. For 75% of these awareness campaigns, the CTR falls between 0.19% and 0.71%. Notably, in this phase, CTR is calculated based on all clicks—including clicks to your company profile or ad reactions—not just clicks to your landing page. Consequently, the actual number of clicks to your website is usually slightly lower.
CTR is equally relevant in other stages, as shown in the image below. Perhaps the most critical stage for CTR is the Website Traffic phase. Here, we achieve an average CTR of 0.78%. In 75% of cases, this ranges between 0.46% and 1.30%. Note that in this specific campaign type, only a click to your website counts toward the CTR, which differs from the calculation used in the awareness phase.
A striking takeaway from our 2025 LinkedIn Benchmark compared to 2024 is the overall increase in CTR. In both awareness and traffic campaigns, we see higher average click-through rates. Does this mean the LinkedIn algorithm has become better at identifying interested users? Are users more inclined to click than in previous years? Or have our campaigns simply improved? While it’s hard to isolate a single cause, the upward trend in CTR is undeniable. Interestingly, this trend does not extend to lead generation campaigns, where average CTR has actually seen a slight decline.
Benchmark: Average CPM on LinkedIn
Perhaps the most vital cost metric to track is your Cost Per Mille (CPM)—the cost of showing your ad one thousand times. CPM is a powerful tool for comparing performance across different campaigns because, unlike clicks, it is calculated identically regardless of the campaign objective. It is also a standard bidding strategy and a reliable factor for forecasting future budgets based on historical data.
Average CPMs have risen significantly in recent years as competition on LinkedIn intensifies. However, we still consider LinkedIn the premier platform for B2B advertising, and the CPM remains well worth the investment. Here is what you can expect to pay per campaign goal:
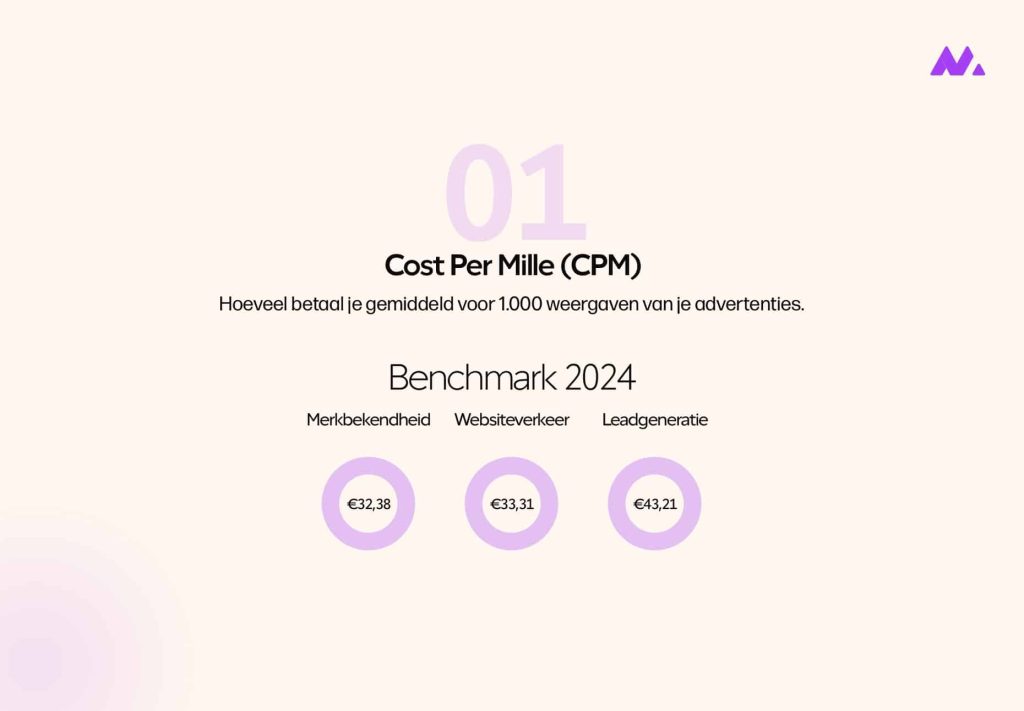
On average, we see a CPM of €32.38 for Brand Awareness and €33.81 for Website Traffic. Compared to our 2024 benchmark, these two have moved closer together, primarily due to rising costs in awareness campaigns. In the vast majority of cases, awareness campaigns cost between €14.02 and €44.05 per 1,000 impressions. For website traffic, this range is between €22.53 and €42.10.
New to our benchmark is the analysis of video campaigns. We use these frequently to bolster brand awareness. The average CPM for video is slightly lower than awareness at €24.14, with most campaigns falling between €13.08 and €32.46. Given that video ads tend to hold an audience’s attention longer, we find this exceptionally good value.
Lead generation campaigns are often the most prized on LinkedIn, but they come at a premium. Our benchmark shows an average CPM for Leads of €43.21, with 75% of our campaigns costing between €21.10 and €64.63 per 1,000 impressions.
CPT: Reaching 1,000 unique people on LinkedIn
While CPM tracks impressions, we also track the Cost Per Thousand (CPT)—the cost to reach 1,000 unique individuals.
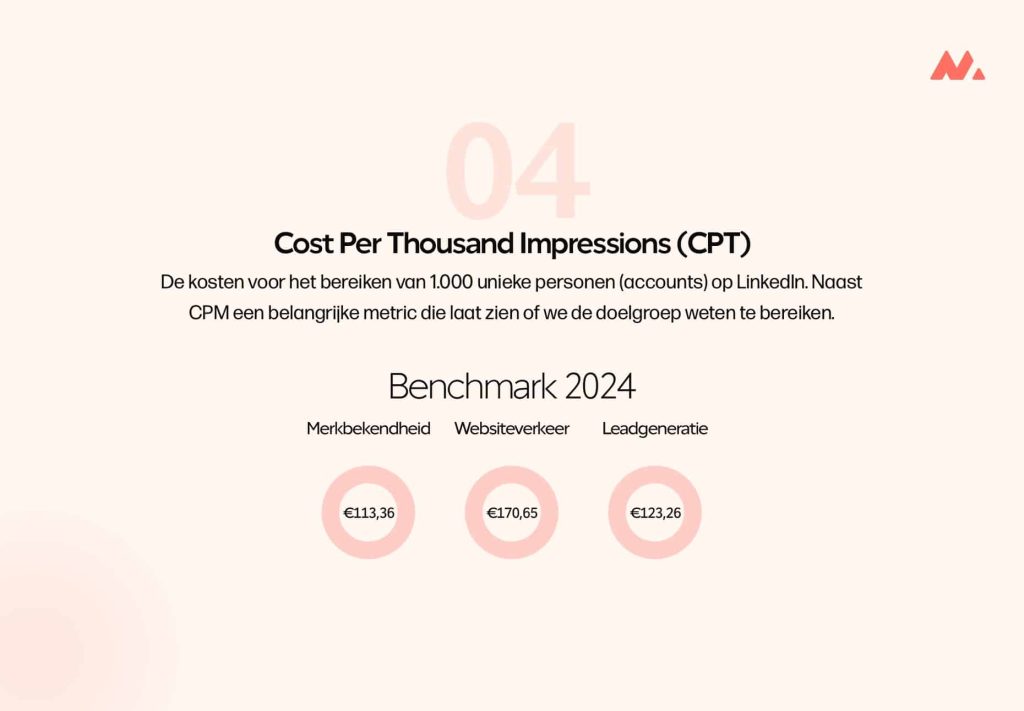
For an awareness campaign, this costs €113.36 on average, with a 75% range of €54.16 to €156.20. For website traffic, the cost is higher at an average of €170.65, though this varies wildly from €76.41 to €273.22.
You might expect lead generation to be the most expensive here as well. Surprisingly, while the CPM is high, the cost per 1,000 unique people is often lower than traffic campaigns, averaging €123.26 (ranging from €61.28 to €179.11).
The standout result, however, comes from video campaigns. The average CPT for video is just €86.81 (ranging from €56.75 to €103.74). This means that while video impressions might cost slightly more than awareness ads, you actually achieve a larger reach for the same budget.
Why is it easier to reach a large audience with video? We suspect two factors: either LinkedIn is prioritizing video content to match other social platforms, or competitors are simply underutilizing video. Regardless, video represents a massive opportunity to boost brand awareness on the platform.
Average CPC in LinkedIn advertising
How much does it cost to generate a single click? This is measured by Cost Per Click (CPC). Here, the gap between campaign types is smaller. This makes sense: campaign costs generally rise as the value of the desired action increases. While awareness campaigns generate far more impressions, the percentage of users who click increases in traffic and lead campaigns, which keeps the rising cost-per-click relatively manageable.
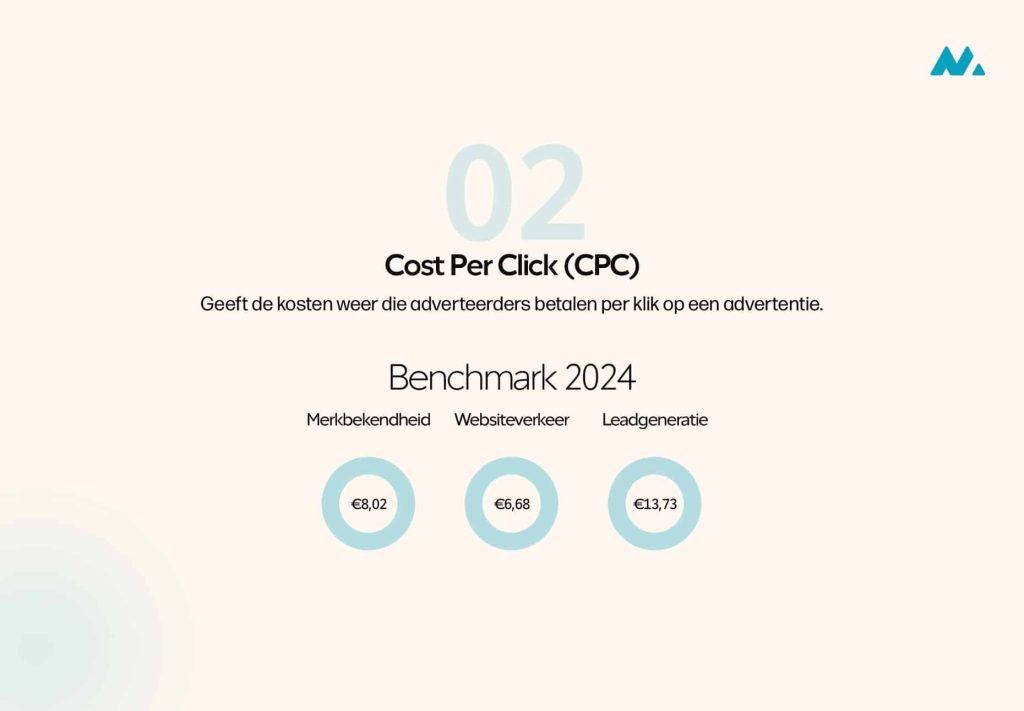
On average, a click in an Awareness campaign costs between €2.12 and €9.60. For Website Traffic, this sits between €2.53 and €7.46. Lead campaigns see a CPC ranging from €4.35 to €20.27. Video clicks are the most expensive, averaging €7.35 to €16.67. This higher CPC, combined with a lower average CTR, is the primary reason we recommend video mostly for awareness rather than direct-click campaigns.
Biggest differences between the 2024 and 2025 benchmarks
Like any digital landscape, LinkedIn and its users are constantly evolving. Here are the key shifts we’ve observed over the past year:
- CPM has spiked, especially for awareness. While we can’t pinpoint a single reason, the surge in B2B competition on LinkedIn over the last two years is a clear driver. Higher demand equals higher prices.
- CTR has risen alongside CPM. This suggests that while impressions are harder to come by, they have become more valuable. You may be paying more to show your ad, but you’re getting more clicks for your money—and a click to your site is always worth more than a passive view.
- Average Cost Per Lead (CPL) has actually dropped. Despite rising CPMs and a slight dip in lead-gen CTR, we have paid less per lead over the last 18 months. This indicates that lead generation is currently more efficient than it has been in years.
What results can you expect from LinkedIn campaigns?
Now for the most frequently asked question: what will I get for my money? Here is a breakdown of what a €1,000 budget will typically net you across the four main objectives:
Campaign results: LinkedIn brand awareness
With a €1,000 spend on Brand Awareness, you can expect roughly 30,000 impressions reaching nearly 9,000 individuals. This averages to about 3 impressions per person—a crucial frequency for building recognition for a brand that isn’t yet a household name.
Average results: LinkedIn website traffic
If your goal is to drive traffic, a €1,000 budget will typically generate 150 clicks to your site. This comes on top of the 29,000+ impressions and reach of 5,800 people that the campaign naturally provides.
LinkedIn lead generation: Average campaign results
LinkedIn is peerless in B2B lead generation. For €1,000, you can expect to generate an average of 13 leads. This budget will also provide approximately 23,000 impressions and reach 8,000 people. A key note: we almost exclusively use native LinkedIn Lead Gen Forms. In our experience, sending users to an external landing page significantly reduces conversion rates.
Average results: Video views on LinkedIn
Video is the “hidden gem” of our latest benchmark. For €1,000, you can expect nearly 2,000 views alongside 41,000 impressions and a reach of 11,000 people. Remember: LinkedIn counts a “view” when someone watches for 3 seconds, goes full-screen, or enables audio. For the best impact, we recommend keeping videos under one minute.
Getting started with LinkedIn advertising
We’ve laid out the hard data here, but turning these numbers into a winning strategy is an art in itself. These best practices are built on years of running LinkedIn campaigns for a wide range of B2B clients. Whether your goal is brand recognition, web traffic, or high-value leads, we know how to deliver. Ready to explore the possibilities for your brand? Get in touch, and let’s start a conversation about your organic and paid LinkedIn opportunities.
Want to learn more? We’ve gathered all our insights on our LinkedIn advertising page.