LinkedIn Advertising Benchmark 2024
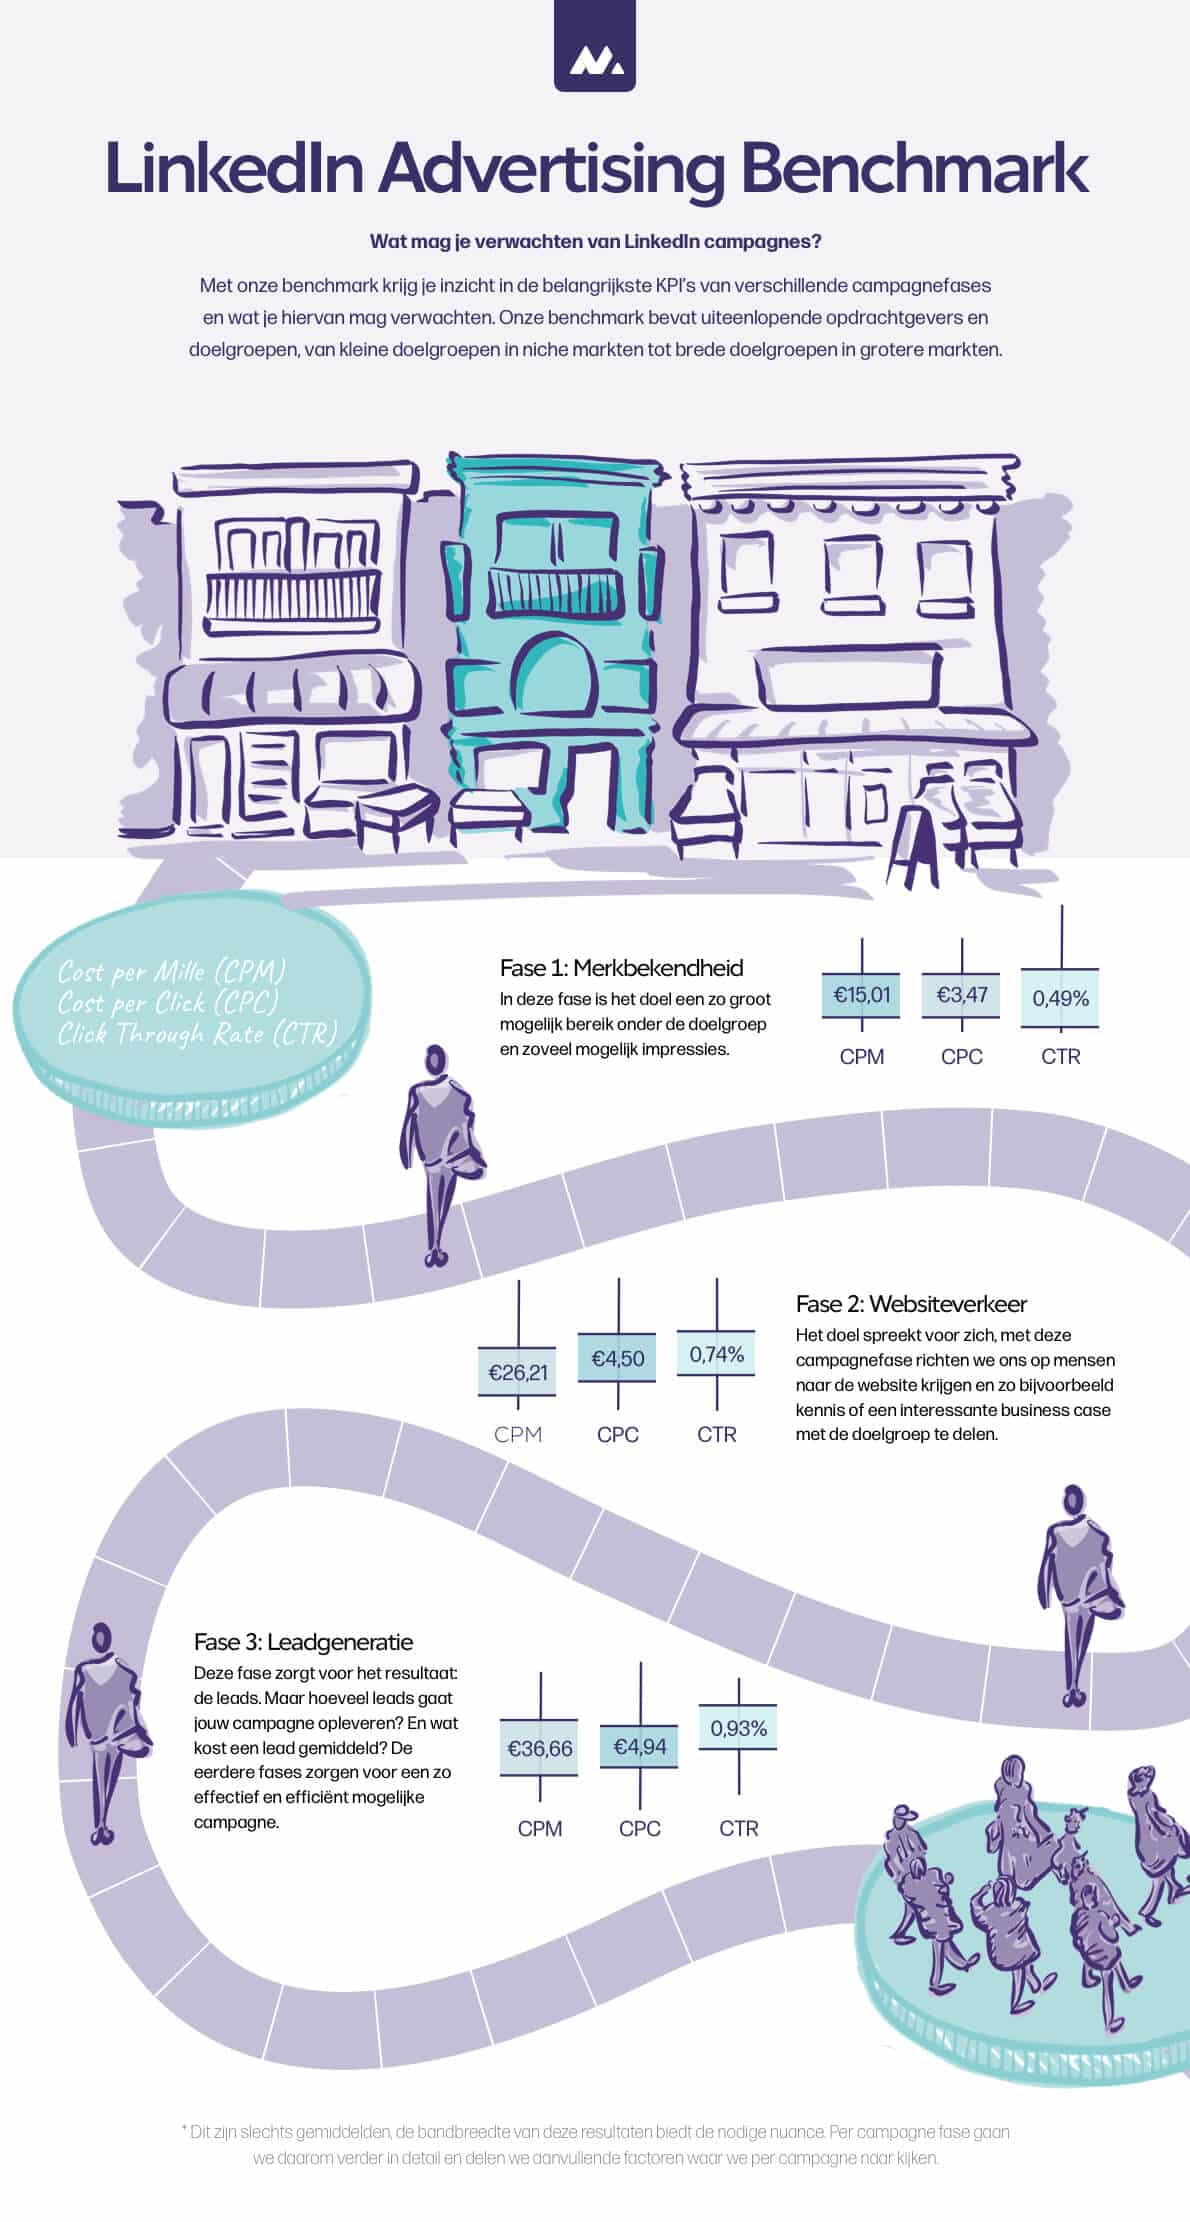
What results should you expect from a LinkedIn Advertising campaign? At its core, the answer is simple: based on your campaign objectives, you can expect impressions, clicks, leads, or applicants. But how many, and at what cost? That is a bit more complex. Based on our LinkedIn Benchmark, we can provide an answer. We’ve mapped out what you can expect from various LinkedIn campaign KPIs, based on our actual campaign results.
We primarily work for B2B companies active in Western Europe. These brands mainly use LinkedIn Advertising to acquire new customers, while a minority use it to stay top-of-mind with existing relations. In our experience, a LinkedIn Advertising strategy consisting of three campaigns—brand awareness, website visits, and lead generation—delivers the best results and the highest volume of leads. In this article, we discuss the KPIs for each of these phases.
This benchmark utilizes all the data we gathered in the past few years to help you set your expectations for LinkedIn Advertising in 2024.
CTR LinkedIn benchmark
What percentage of your impressions leads to a click? We call this the Click-Through Rate (CTR), and it’s a KPI we monitor in every campaign. The CTR indicates the level of interest in your topic, product, or service in combination with the ad creative. A high CTR is a positive sign; with a low CTR, we first ask whether the ad is visually engaging before examining the actual content. But to judge that, you need to know what “normal” looks like.
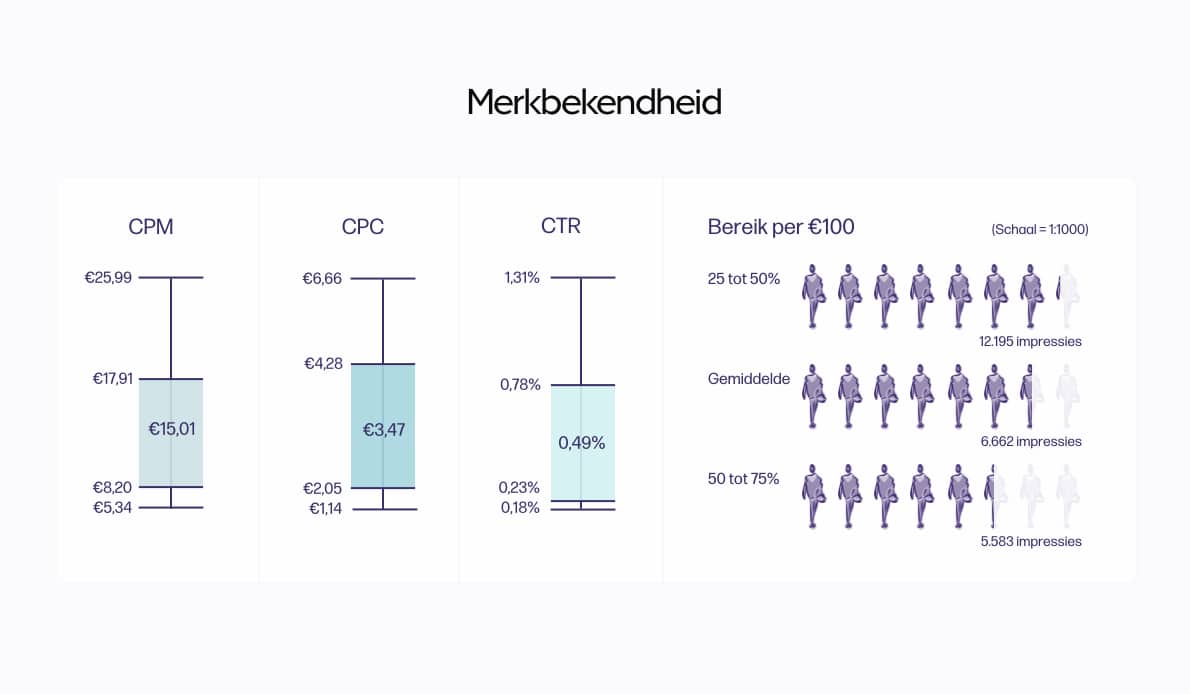
In the brand awareness phase, our campaigns see an average CTR of 0.49%. For 75% of all awareness campaigns, the CTR falls between 0.23% and 0.78%. Note that in this phase, the CTR is calculated based on all clicks on the campaign—not just clicks to your landing page, but also clicks to your LinkedIn profile or ad reactions. Therefore, the actual number of clicks to the landing page is often slightly lower.
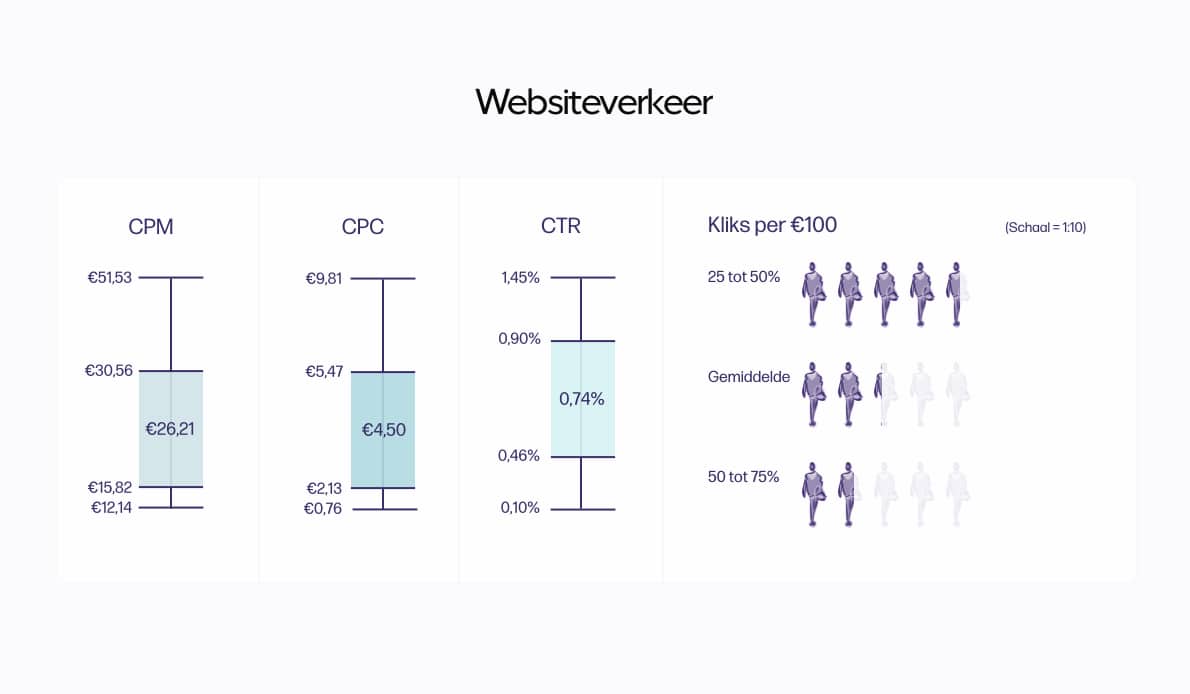
This picture changes when we look at campaigns focused on website clicks. Here, only a click to your landing page counts. According to our LinkedIn benchmark, the average CTR for this type of campaign is 0.74%. In 50% of these campaigns, the CTR lies between 0.46% and 0.90%.
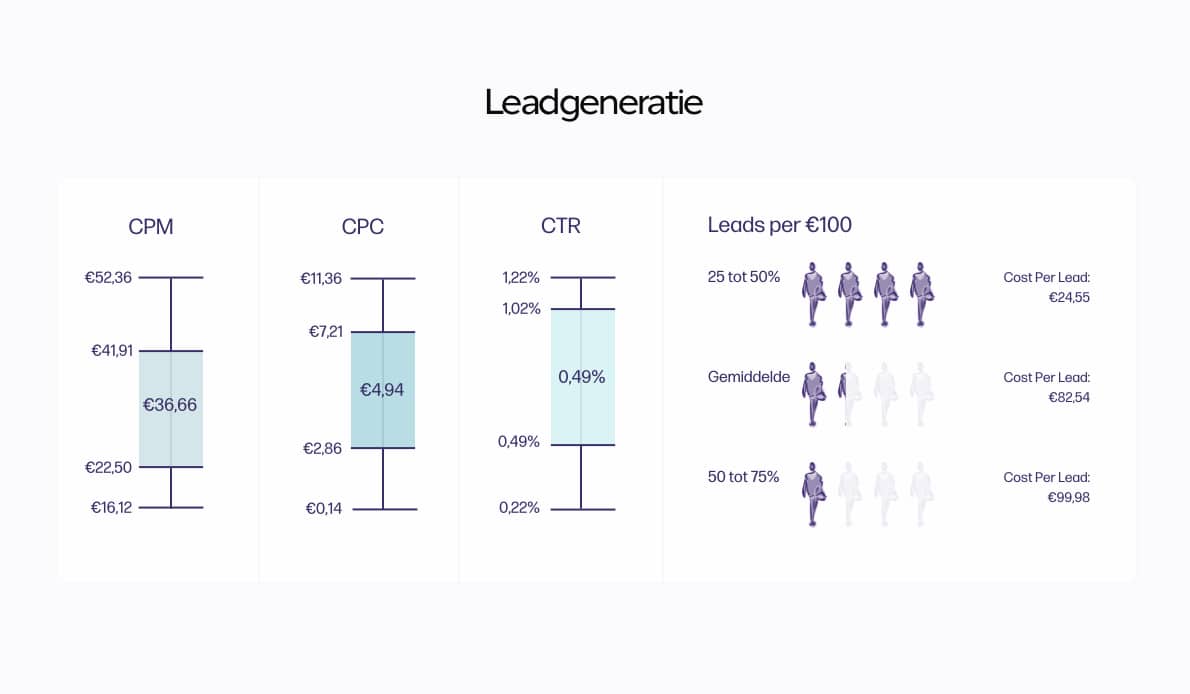
For lead campaigns, we see that the average CTR is even slightly higher, at 0.93%. Across all campaigns, the CTR for 50% of the cases falls between 0.49% and 1.02%.
Average CPC in a LinkedIn Advertising campaign
How much do you need to spend on average to generate a click on LinkedIn? We evaluate this based on the Cost Per Click (CPC). Here, we see a smaller discrepancy between campaign types, which is logical: campaign types generally cost more as the desired action becomes more valuable. An awareness campaign generates far more impressions and reaches more people than a lead campaign. We have also observed that the click percentage increases in campaigns focused on website traffic and leads, which keeps the rising cost per click relatively manageable.
On average, a click on LinkedIn for a Brand Awareness campaign costs between €2.05 and €4.28. In a campaign focused on website clicks, a click costs on average €2.13 to €5.47, and for lead campaigns, the average Cost Per Click ranges from €2.86 to €7.21.
CPM LinkedIn benchmark
Perhaps the most important cost factor to monitor is your Cost Per Mille (CPM)—the cost to show your ad one thousand times. CPM is a metric that allows you to easily compare the performance of different campaigns because, unlike clicks, it is calculated the same way for every campaign goal. Furthermore, it is a frequently used (default) bidding strategy, allows for easy cost comparison across campaign types, and is a reliable factor for setting budgets for future campaigns based on historical results.
LinkedIn itself uses CPM as the primary tool to determine campaign costs. So, what is an average CPM for a LinkedIn campaign? In our experience, the difference in CPM between various campaign goals is larger than the difference in Cost Per Click. Our LinkedIn benchmark shows that the CPM averages €15.01 for a brand awareness campaign; when the goal is website clicks, the CPM rises to €26.21; and for LinkedIn lead campaigns, the average CPM is €36.66.
The differences are smallest when looking specifically at brand awareness campaigns, where 50% of campaigns had a CPM between €8.20 and €17.91. The number of campaigns with a significantly higher CPM is very limited. In website traffic and lead campaigns, the variances are larger. In 50% of website click campaigns, the CPM falls between €15.82 and €30.56. For lead campaigns, this is between €22.50 and €41.91. The difference compared to awareness campaigns is that we see more extreme outliers in both lead and website campaigns.
LinkedIn benchmark: What results can you expect?
Now that we know the averages of several frequently used LinkedIn KPIs, let’s look at the output of different campaign types. What results can you expect from various LinkedIn campaigns:
- Brand awareness
- Website traffic
- Lead generation
Both reach and impressions are heavily influenced by the size of the target audience. Since our clients are active in B2B markets, we work with very specific niche audiences, allowing us to achieve high impressions and significant reach with a relatively modest budget. We generally aim to reach approximately 50% of the target audience.
LinkedIn brand awareness campaign results
When setting up an awareness campaign, the primary metrics are impressions and reach. These measure how many individuals have seen an ad at least once or multiple times.
On average, we achieve approximately 6,662 views among 2,750 LinkedIn members for every €100 of campaign budget. That averages out to 2.4 views per LinkedIn account.
LinkedIn website traffic results
The desired outcome of a website traffic campaign is self-explanatory: getting as many people to the website as possible.
On average, we generate 22 website visits for every €100 of campaign budget. This is in addition to the people who saw the campaign during this phase, as you continue to build brand awareness. On average, this amounts to 3,846 views.
LinkedIn lead generation campaign results: Costs and returns
What does a LinkedIn lead generation campaign yield on average? This question is more complex because the results vary more widely and our clients’ propositions differ so much. One might target a highly specific niche, while another has a much broader audience or offer. Leads in a niche market are typically worth more, but the campaign generally produces fewer of them.
The average cost per lead varies from €24.55 to €99.98.
Get started with LinkedIn advertising
Merkelijkheid works for various companies, primarily in B2B markets. For many businesses, we successfully utilize LinkedIn to build brand awareness, drive website traffic, and generate valuable leads.
In this post, we’ve laid out the hard data from our experience, but we know this isn’t everyday knowledge for everyone. Would you like to explore the possibilities with us or do you have a specific goal in mind? Contact us, and let’s start a conversation about the organic and paid opportunities on LinkedIn!
Want to read more? We’ve gathered all our insights on our LinkedIn advertising page.