LinkedIn Benchmark 2024
You are ready to take your LinkedIn Ads activities to the next level and are taking the first steps for a LinkedIn Advertising campaign. But, what can you expect? We are happy to tell you, based on our updated LinkedIn Benchmark in which we now include data from video campaigns for the first time. Based on nearly two hundred campaigns in various markets, we take you into the world of LinkedIn Advertising: from CPM and CPC to CTR, Engagement rate, and much more.
We mainly work for B2B companies active in Western Europe. These brands primarily want to acquire new customers with LinkedIn Advertising; a minority use LinkedIn Ads to reach existing relationships. Our experience is that a LinkedIn Advertising strategy with 3 campaigns; brand awareness, website visits, lead generation, delivers the best results. The most leads. In addition, we regularly deploy video campaigns to support brand awareness and lead generation. In this article, we therefore discuss the KPIs of these phases.
CTR LinkedIn Benchmark
What percentage of your impressions leads to a click? That is called the Click Through Rate (CTR), and it is a KPI we look at in every campaign. The CTR says something about the interest in your topic, product, or service in combination with the ad. A high CTR is a good sign; with a low CTR, we first ask ourselves whether the ad appeals, then look at its content. But of course, you need to know what ‘normal’ is.
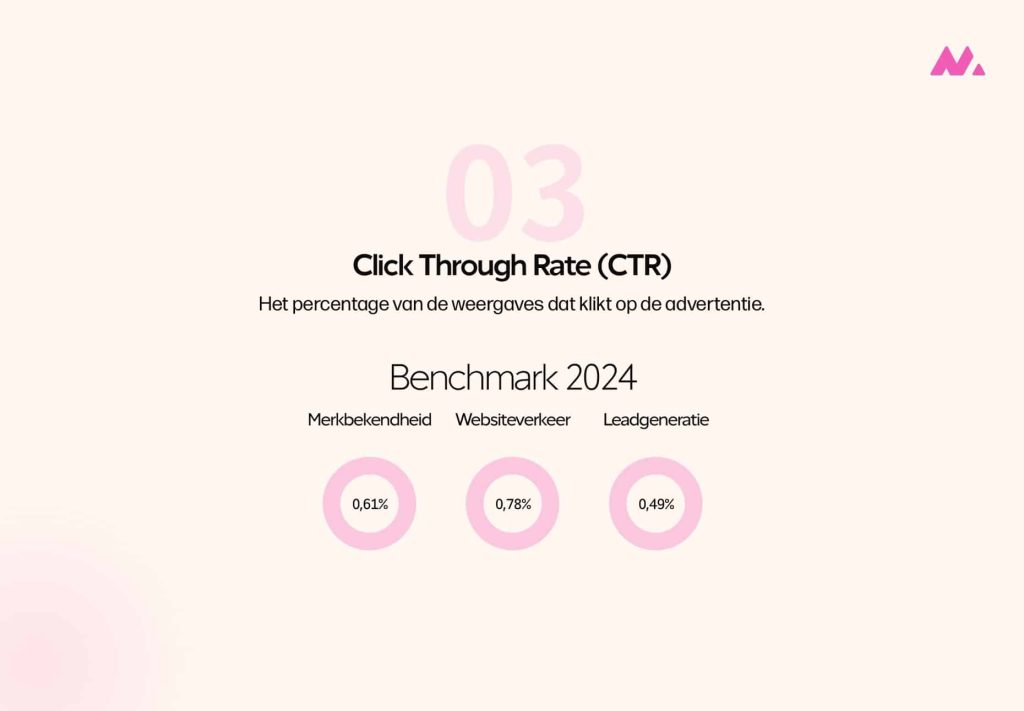
In the brand awareness phase, our LinkedIn campaigns have an average CTR of 0.61%. And of all brand awareness campaigns, the CTR falls between 0.19% and 0.71% in 75% of cases. The CTR in this phase is calculated based on all clicks on the campaign, so not only clicks to your landing page but also clicks to your LinkedIn profile or one of the ad’s reaction options. The actual number of clicks to the landing page is therefore often slightly lower.
The CTR is of course also relevant in other campaign phases, which we explain in the image below. Perhaps the most relevant campaign phase for which we discuss CTR is the website traffic phase. With this type of campaign, we achieve an average CTR of 0.78%. Of all website traffic phases, the CTR lies between 0.46% and 1.30% in 75% of cases. Incidentally, here only the click to your website counts as a click for the CTR, so this differs slightly from the brand awareness phase.
Notable in the LinkedIn Benchmark 2024 compared to 2023 is the increase in CTR. In campaigns aimed at brand awareness and website traffic, we see an average higher CTR. Does this mean that the LinkedIn algorithm better understands which part of our target audience is interested in the campaigns? Or are people on LinkedIn perhaps more inclined to click through than in previous years? Or maybe our campaigns have improved? It is hard to say, but we can speak of an upward trend in CTR. This increase is not seen in lead campaigns; there we actually see a decrease in average CTR.
[merkelijkheidcta tag_id=’linkedin-adverteren-1′]
Benchmark: average CPM on LinkedIn
Perhaps the most important cost factor to monitor is your Cost Per Mille (CPM), the amount it costs to show your ad one thousand times. Cost Per Mille is a factor with which you can easily compare the performance of different campaigns because it is calculated the same way for every campaign objective, unlike clicks, for example. Additionally, it is a commonly used (standard) bidding strategy, you can fairly easily compare costs for different types of campaigns based on your CPM, and CPM is a reliable factor to set budgets for your next campaigns based on previous results.
The average CPM has risen sharply in recent years, partly because advertising on LinkedIn is becoming more frequent. Yet, in our opinion, LinkedIn is still a very relevant platform to advertise for a B2B audience, and the CPM is still well worth it. Curious about which CPM you can expect? We break it down per campaign objective.
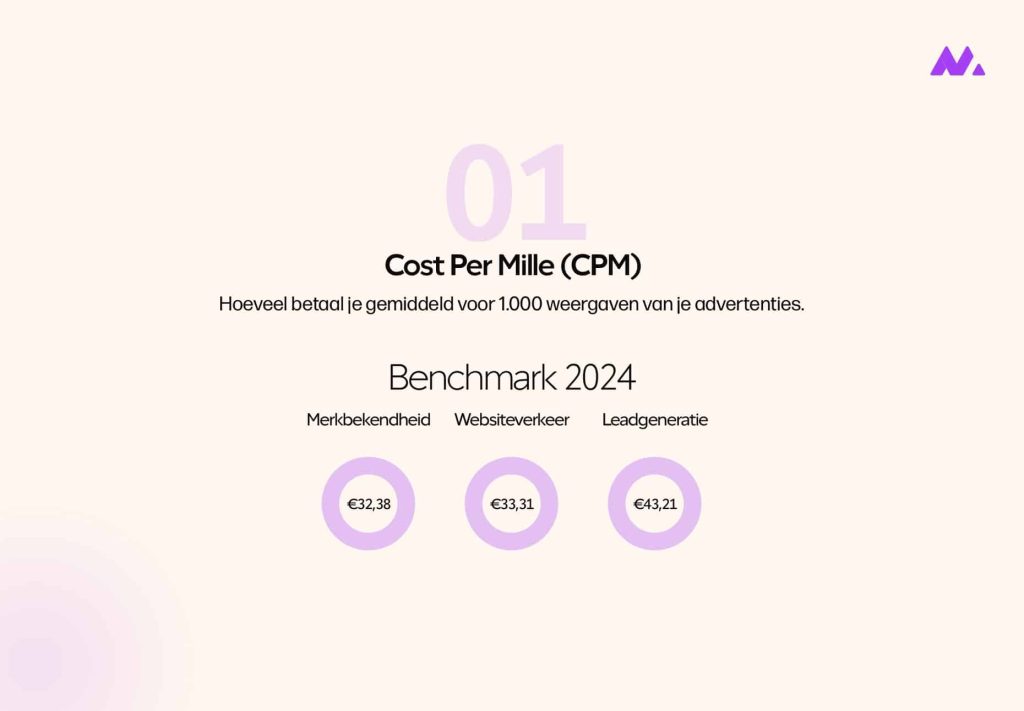
On average, we achieve a CPM of €32.38 for brand awareness and €33.81 for website traffic. Compared to our 2023 benchmark, these two have come much closer together, mainly due to the higher CPM of brand awareness campaigns. In the vast majority of cases, we pay €14.02 to €44.05 for 1,000 impressions with brand awareness as the goal. For website traffic, this is between €22.53 and €42.10.
New in our benchmark are the analyses of video campaigns. We use these very regularly on LinkedIn to support brand awareness. The average CPM is slightly higher than a brand awareness campaign, which we find understandable because you manage to engage and hold your audience a bit longer with a video ad. On average, the CPM is €24.14, and in the vast majority of our campaigns, we pay €13.08 to €32.46 per 1,000 impressions.
Lead generation campaigns are perhaps the most valuable campaigns on LinkedIn. But what does that cost? The average CPM for Leads according to our benchmark is €43.21, and in 75% of our campaigns, we pay €21.10 to €64.63 for 1,000 impressions.
CPT: reaching 1,000 unique people on LinkedIn
CPM is absolutely a very valuable way to analyze your campaigns and set your budget. What we also always look at is how much it costs to reach 1,000 people, the so-called CPT: Cost Per Thousand.
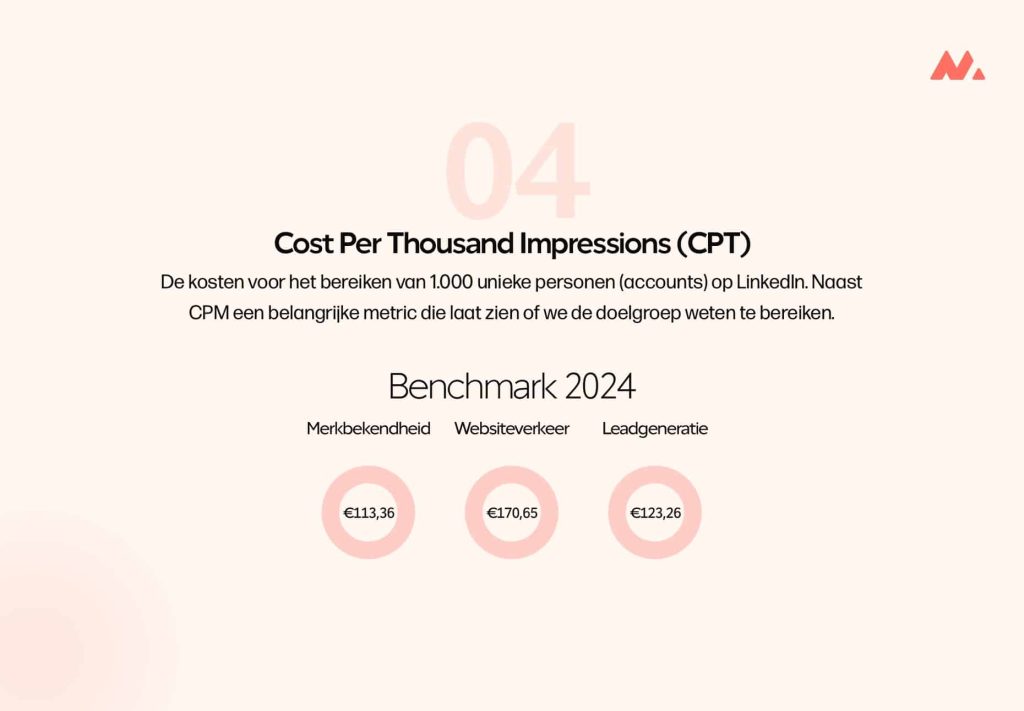
For a brand awareness campaign, this costs an average of €113.36, and in 75% of campaigns, we pay €54.16 to €156.20. In campaigns aimed at website traffic, this is higher; the average is €170.65. But looking at 75% of our campaigns, this varies widely, from €76.41 to €273.22.
You would naturally expect Lead Generation to be the most expensive campaign phase. And that is true, but in cost per 1,000 unique people, we generally pay less in a lead generation campaign. On average, we pay €123.26, and the range for 75% of our campaigns is between €61.28 and €179.11.
Very notable are the results of video campaigns. Here the average is actually below that of brand awareness campaigns: €86.81. And in 75% of campaigns, we pay €56.75 to €103.74. Although achieving 1,000 impressions with video may cost a bit more, you achieve a larger reach with the same budget.
The big question is why you achieve a larger reach more easily with video? We suspect this has to do with two factors (or a combination of both): LinkedIn, following other social media platforms, focuses more on video content, making your video campaign easier to promote. Or competitors make less use of video content on LinkedIn. Either way, we see many opportunities for video campaigns on LinkedIn to increase your brand awareness.
[merkelijkheidcta tag_id=’linkedin-adverteren-2′]
Average CPC LinkedIn advertising campaign
How much do you have to spend on average to get a click on LinkedIn? We assess this based on Cost Per Click (CPC). Here we see less difference per campaign type, which makes sense: campaign types generally cost more as the desired action is more valuable. A brand awareness campaign therefore achieves many more impressions and reaches more people than a lead campaign. We have also found that the percentage of clicks increases in campaigns aimed at website clicks and leads, so the rising cost per click is relatively moderate.
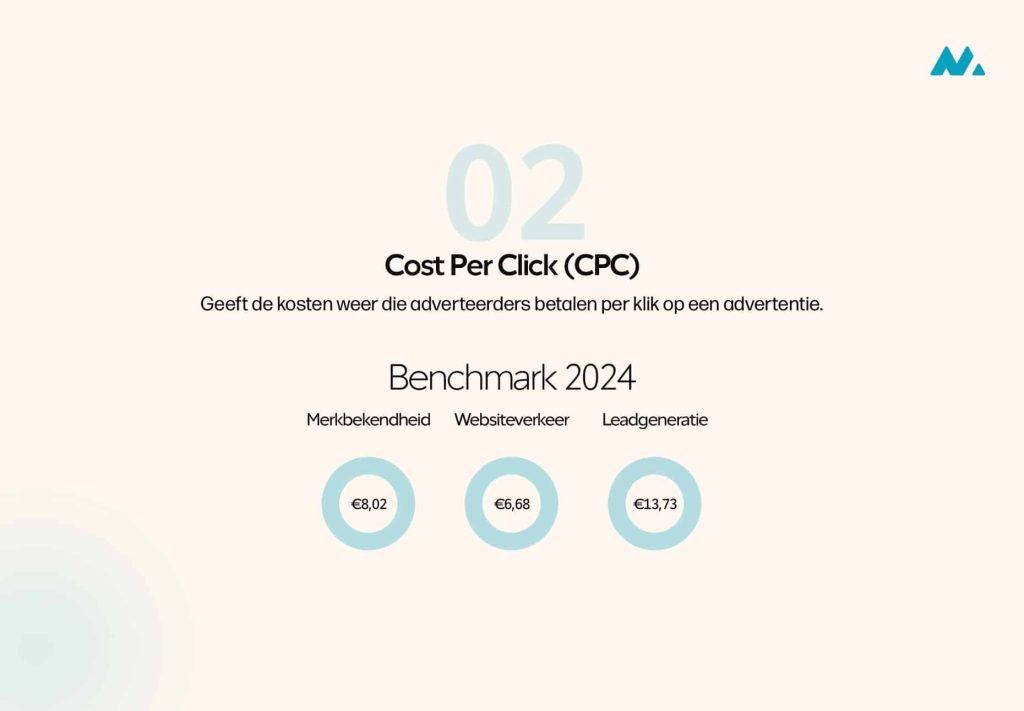
On average, a click on LinkedIn costs €2.12 to €9.60 for a Brand Awareness campaign. In a campaign aimed at website clicks, a click costs €2.53 to €7.46 in 75% of campaigns, and for lead campaigns, the Cost Per Click ranges from €4.35 to €20.27. In video campaigns, a click costs on average €7.35 to €16.67. The higher CPC of video campaigns combined with a lower CTR is the main reason for us to mainly use video campaigns to increase brand awareness.
Biggest differences in LinkedIn advertising benchmark 2023 and 2024
Like all other advertising platforms, LinkedIn continues to evolve, and the behavior of its visitors changes as well. We outline a few points where we see differences in our benchmark between 2023 and 2024.
- The CPM has risen sharply, especially in brand awareness campaigns. Although we cannot pinpoint exactly why, we also see that competition on LinkedIn has increased considerably over the past two years. Not surprising that the price rises! Still, the increase is moderate when looking at website traffic and lead generation.
- The CTR has also increased, so the CPC has not risen as sharply as the CPM. In our view, this means that achieving impressions may have become somewhat more difficult, but the impressions may have become more valuable if you get more clicks from them. Because let’s be honest, a click to your website is worth more than the impressions of your ads, right?
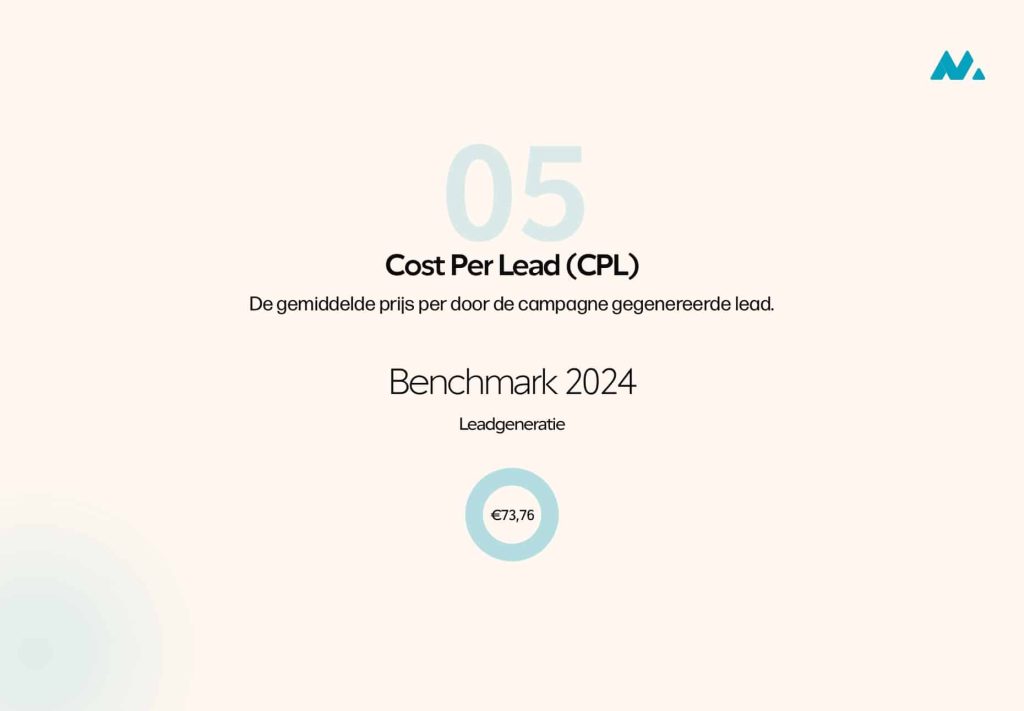
- The average cost per lead has decreased. Although we also see a slight increase in CPM here and even a decrease in CTR, we have paid less per lead in the past year and a half. We see opportunities!
[merkelijkheidcta tag_id=’linkedin-adverteren-2′]
What results can you expect from LinkedIn campaigns?
Now that we have discussed the averages and notable changes in the LinkedIn benchmark, it is time to answer the most frequently asked question. What results can you expect from LinkedIn campaigns? We briefly discuss this for the four different campaign objectives, based on €1000:
- Brand Awareness
- Website Traffic
- Video Views
- Lead Generation
Campaign results LinkedIn brand awareness
When you spend €1000 on a brand awareness campaign on LinkedIn, you can expect to achieve about 30,000 impressions, among nearly 9,000 people. This means you achieve on average just over 3 impressions per person; in this phase, we find that extra important because your brand is probably still relatively unknown to your target audience.
Average results of LinkedIn website traffic campaign
When you want to generate clicks to your website, you can expect that with a budget of €1000, you will send someone to your website about 150 times on average. This is of course on top of the more than 29,000 impressions among 5,800 people that you achieve with a website traffic campaign.
LinkedIn lead generation: average campaign results
In B2B lead generation, LinkedIn is truly unique. But what can you expect? Based on €1000, you generate on average 13 leads on LinkedIn. In addition, you achieve about 23,000 impressions and can reach about 8,000 people with this budget. An important note here is that we almost always execute lead generation with a lead form on LinkedIn. We consciously choose not to send people to a landing page to convert there, because in our experience this leads to fewer leads.
[merkelijkheidcta tag_id=’linkedin-adverteren-2′]
Video views on LinkedIn, the average campaign results
New in our benchmark and in our opinion really an opportunity on LinkedIn, video campaigns. When you spend €1000 budget, you can expect, besides 41,000 impressions among over 11,000 people, to achieve nearly 2,000 views. It is good to realize that LinkedIn counts a view when someone watches longer than 3 seconds, uses fullscreen, or plays the sound of your video. For the best result, we recommend using a short video, up to a maximum of one minute.
Getting started with LinkedIn advertising
In this post, we list the hard results of our experience, but that is not easy for everyone. We base these results and best practices on years of experience with LinkedIn advertising for various companies in diverse B2B markets. We work for our clients on brand awareness, website visitors, and valuable leads. Would you like to explore the possibilities with us or do you have a specific question or goal in mind? Then contact us, and we will talk with you about the organic and paid opportunities of LinkedIn!
Want to read more? We collect all information on our page about LinkedIn advertising.