LinkedIn Benchmark 2024
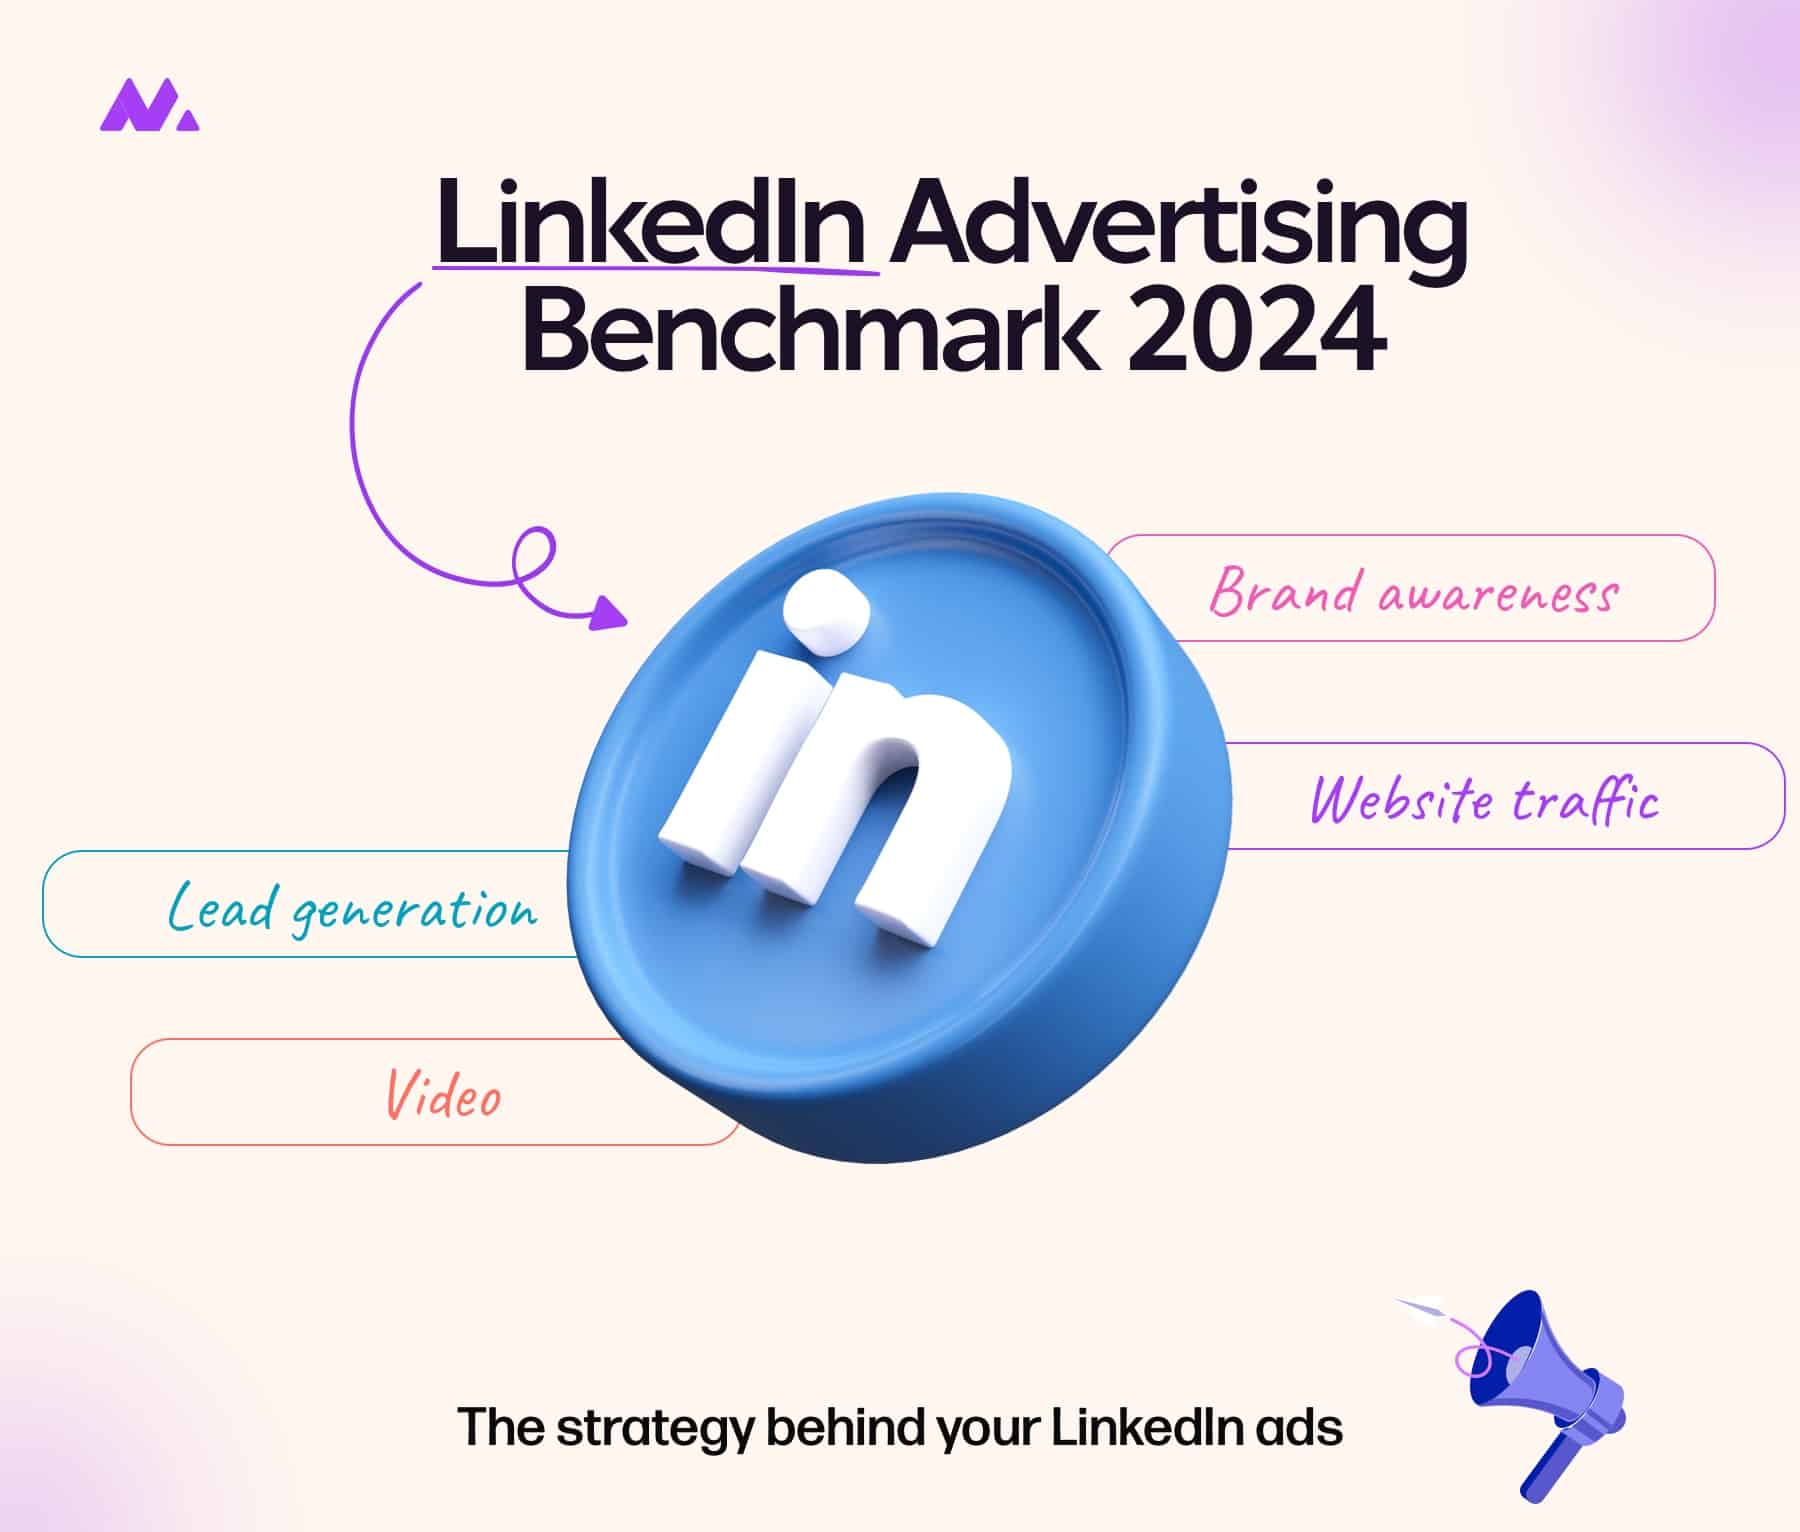
We primarily work with B2B companies operating in Western Europe. These brands mainly use LinkedIn Advertising to acquire new customers, with a minority using it to reach existing relationships. Our experience shows that a LinkedIn Advertising strategy with three types of campaigns—brand awareness, website traffic, and lead generation—yields the best results. It generates the most leads. Additionally, we frequently use video campaigns to support brand awareness and lead generation. In this article, we’ll discuss the KPIs for these phases.
CTR LinkedIn Benchmark
What percentage of your views results in a click? This is known as the Click-Through Rate (CTR), a KPI we examine in every campaign. The CTR indicates the level of interest in your topic, product, or service, combined with the advertisement. A high CTR is a good sign; with a low CTR, we first question whether the ad is engaging before looking at its content. But you need to know what’s ‘normal’.
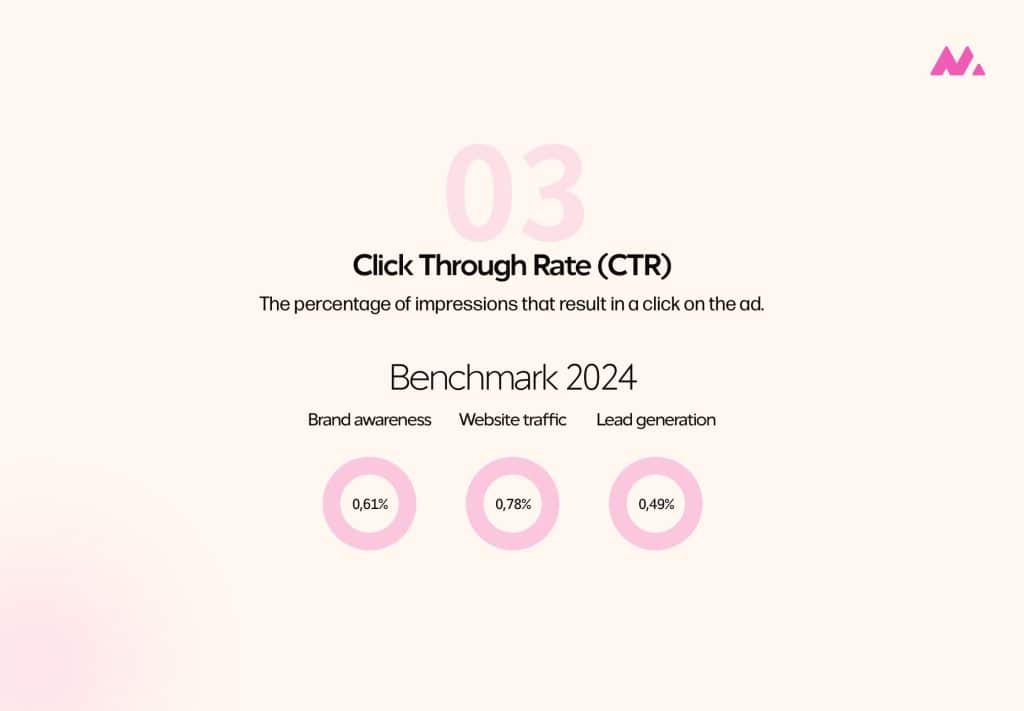
In the brand awareness phase, our campaigns have an average CTR of 0.61%. Among all brand awareness campaigns, the CTR falls between 0.19% and 0.71% in 75% of cases. In this phase, the CTR is calculated based on all clicks on the campaign, not just clicks to your landing page but also clicks to your LinkedIn profile or on one of the ad’s interaction options. Therefore, the actual number of clicks to the landing page is often slightly lower.
The CTR is also relevant in other campaign phases, which we explain in the image below. Perhaps the most relevant phase for discussing CTR is the website traffic phase. With this type of campaign, we achieve an average CTR of 0.78%. In 75% of all website traffic phases, the CTR ranges between 0.46% and 1.30%. Here, only clicks to your website count towards the CTR, which differs slightly from the brand awareness phase.
A notable trend in the LinkedIn Benchmark 2024 compared to 2023 is the increase in CTR. In campaigns focused on brand awareness and website traffic, we see a higher average CTR. Does this mean that LinkedIn’s algorithm better understands which part of our audience is interested in the campaigns? Or are people on LinkedIn more inclined to click through than in previous years? Or perhaps our campaigns have improved? It’s hard to say, but we can observe an upward trend in CTR. However, this increase is not reflected in lead campaigns, where we actually see a decline in average CTR.
Benchmark: average CPM on LinkedIn
One of the most critical cost factors to monitor is your Cost Per Mille (CPM)—the amount it costs to show your ad a thousand times. Cost Per Mille is a factor that allows you to easily compare the performance of different campaigns because, unlike clicks, it is calculated the same way for every campaign goal. Additionally, it is a commonly used (standard) bidding strategy, enabling straightforward comparison of costs for different types of campaigns based on your CPM, and CPM is a reliable factor for setting budgets for your next campaigns based on previous results.
The average CPM has risen significantly in recent years, partly because advertising on LinkedIn is becoming more common. Nonetheless, we still see LinkedIn as a highly relevant platform for advertising to a B2B audience, and the CPM is still worth it. Curious about what CPM to expect? We’ll break it down per campaign goal.
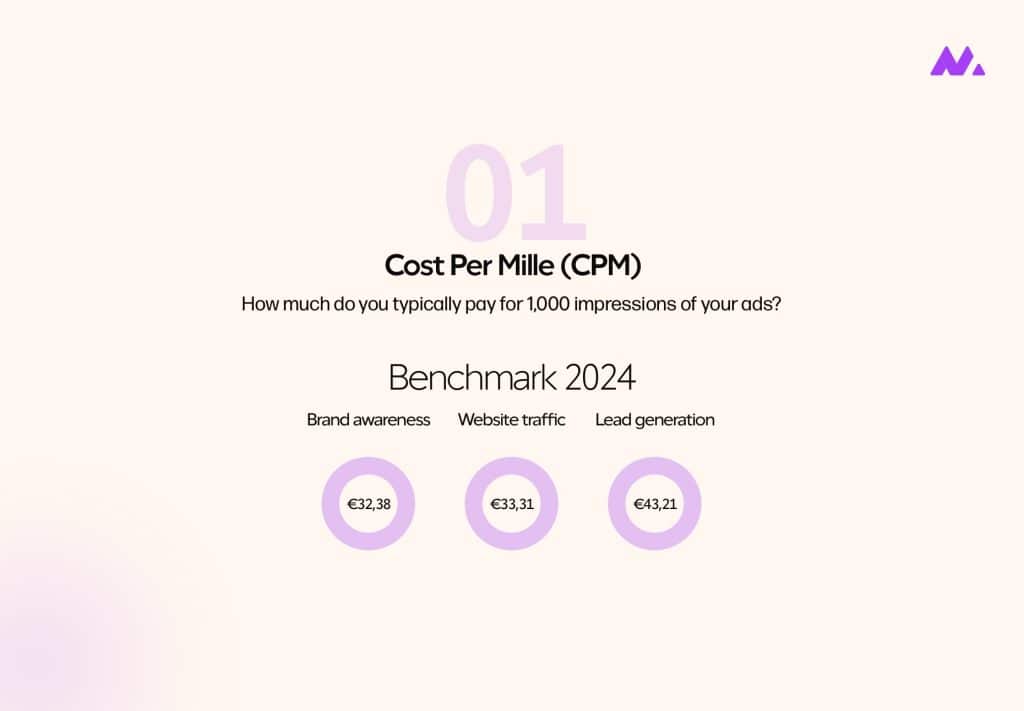
On average, we achieve a CPM of €32.38 for brand awareness and €33.81 for website traffic. Compared to our 2023 benchmark, these two have come much closer together, primarily due to the higher CPM of brand awareness campaigns. In most cases, we pay between €14.02 and €44.05 per 1,000 impressions with brand awareness as the goal. For website traffic, this ranges from €22.53 to €42.10.
New in our benchmark are the analyses of video campaigns. We frequently use these on LinkedIn to support brand awareness. The average CPM is slightly higher than that of a brand awareness campaign, which we find reasonable, as you manage to engage and hold your audience’s attention longer with a video ad. The average CPM is €24.14, and in the vast majority of our campaigns, we pay between €13.08 and €32.46 per 1,000 impressions.
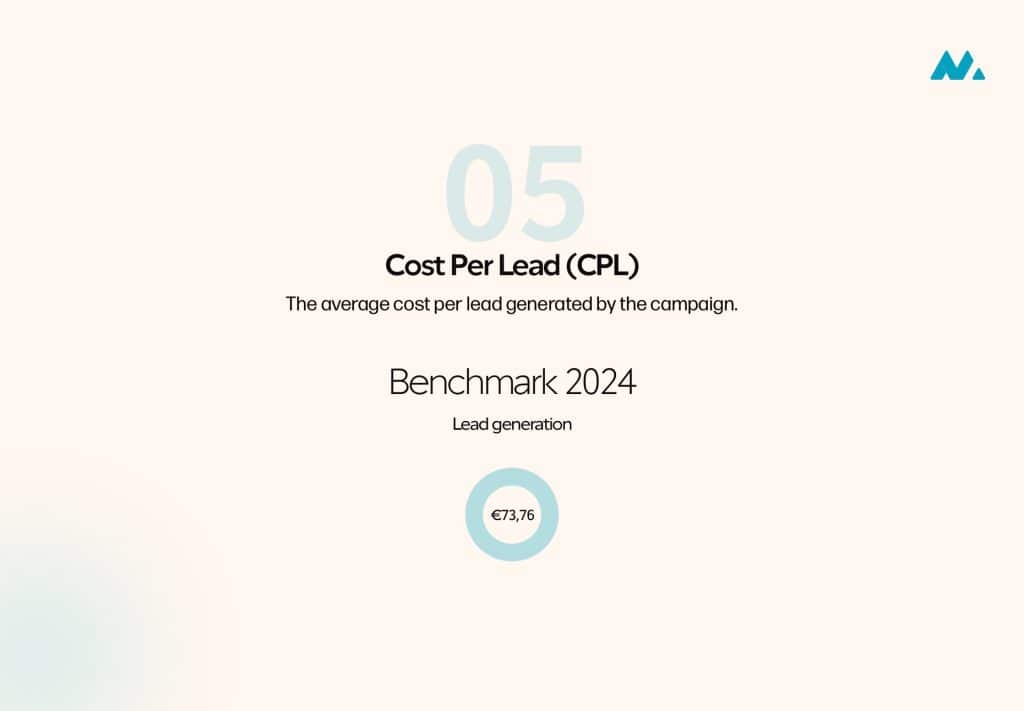
Lead generation campaigns are perhaps the most valuable campaigns on LinkedIn. But what should they cost? According to our benchmark, the average CPM for leads is €43.21, and in 75% of our campaigns, we pay between €21.10 and €64.63 per 1,000 impressions.
CPT: Reaching 1,000 unique people on LinkedIn
CPM is certainly a valuable way to analyze your campaigns and set your budget. We also always consider how much it costs to reach 1,000 people, the so-called CPT: Cost Per Thousand.
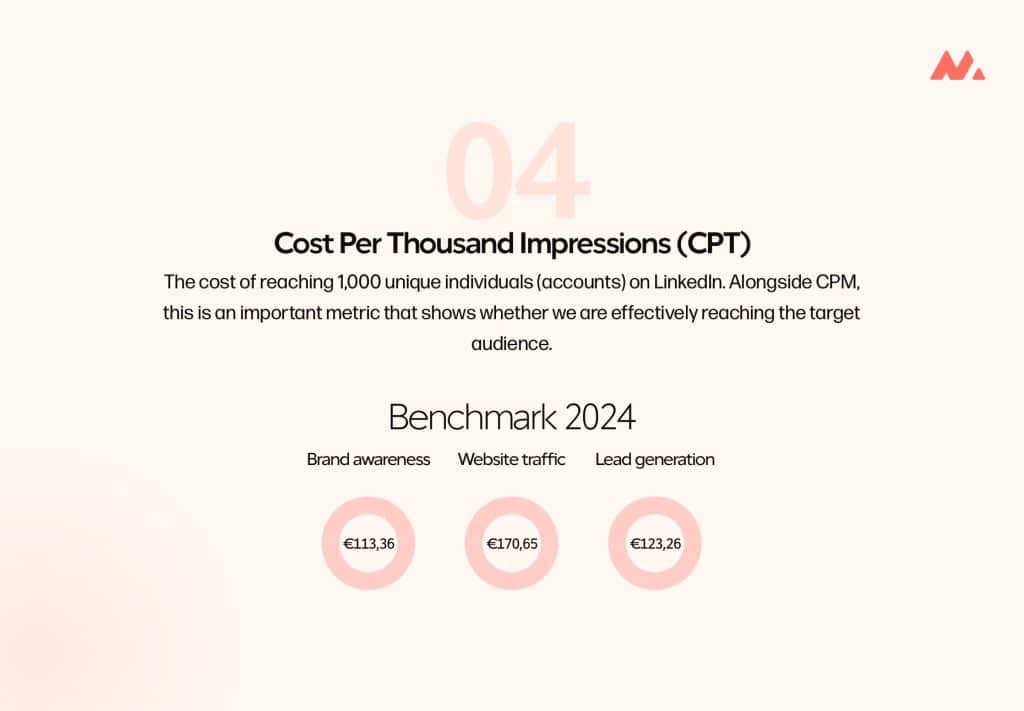
For a brand awareness campaign, this averages €113.36, with 75% of campaigns costing between €54.16 and €156.20. In campaigns targeting website traffic, this is higher, with an average of €170.65. However, looking at 75% of our campaigns, this varies widely, ranging from €76.41 to €273.22.
You might expect lead generation to be the most expensive campaign phase. And that’s true, but we generally pay less per 1,000 unique people in a lead generation campaign. On average, we pay €123.26, and for 75% of our campaigns, this ranges between €61.28 and €179.11.
The results of video campaigns are particularly striking. Here, the average is actually lower than that of brand awareness campaigns: €86.81. In 75% of campaigns, we pay between €56.75 and €103.74. So while achieving 1,000 impressions with video may cost a bit more, you can reach a larger audience with the same budget.
The big question is why it’s easier to achieve a broad reach with video. We suspect this is due to two factors (or a combination of both): LinkedIn, following other social media platforms, is focusing more on video content, making your video campaign easier to promote. Alternatively, competitors may use less video content on LinkedIn. Either way, we see many opportunities for video campaigns on LinkedIn to boost brand awareness.
Average CPC LinkedIn advertising campaign
How much do you need to spend on average to get a click on LinkedIn? We evaluate this based on the Cost Per Click (CPC). Here, we see less variation per campaign type, which makes sense: campaign types generally cost more as the desired action becomes more valuable. A brand awareness campaign, therefore, achieves many more impressions and reaches more people than a lead campaign. We’ve also found that the percentage of clicks increases in campaigns focused on website clicks and leads, so the rising costs per click are relatively moderate.
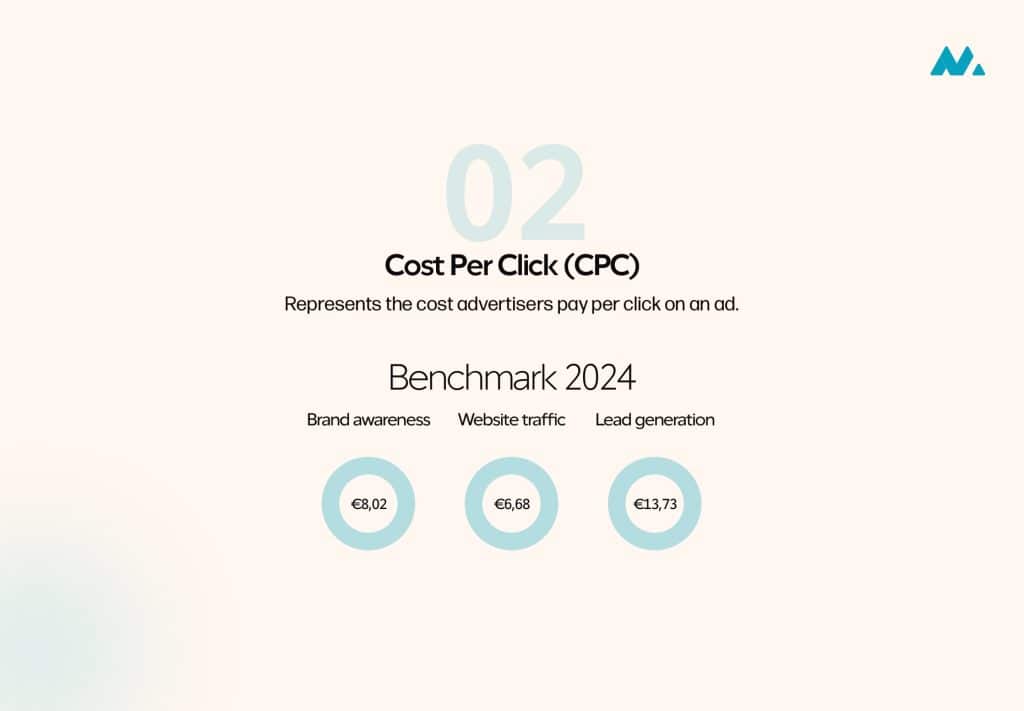
A click on LinkedIn costs an average of €2.12 to €9.60 for a brand awareness campaign. In a campaign aimed at website clicks, a click costs between €2.53 and €7.46 in 75% of cases, while for lead campaigns, the Cost Per Click ranges from €4.35 to €20.27. In video campaigns, a click costs an average of €7.35 to €16.67. The higher CPC of video campaigns, combined with a lower CTR, is the main reason we mainly use video campaigns to enhance brand awareness.
Major differences in LinkedIn advertising benchmark 2023 and 2024
Like all other advertising platforms, LinkedIn is constantly evolving, and so does the behavior of its users. We highlight several differences we observe between 2023 and 2024 in our benchmark.
- The CPM has increased significantly, especially in brand awareness campaigns. Although we can’t pinpoint the exact reason, we’ve noticed that competition on LinkedIn has increased significantly over the past two years. So, it’s not surprising that the price is rising! However, the increase is less pronounced when we look at website traffic and lead generation.
- The CTR has also increased, so the CPC has not risen as sharply as the CPM. We believe this means that although achieving impressions may have become more challenging, those impressions may be more valuable if you get more clicks from them. After all, a click to your website is worth more than just ad impressions, right?
- The average cost per lead has decreased. Even though we see a slight increase in CPM and a decrease in CTR, we’ve paid less per lead over the past year and a half. We see opportunities!
What results can you expect from LinkedIn campaigns?
Now that we’ve discussed the averages and notable changes in the LinkedIn benchmark, it’s time to answer the most frequently asked question. What results can you expect from LinkedIn campaigns? We’ll briefly cover this for the four different campaign goals, based on a budget of €1000:
- Brand awareness
- Website traffic
- Video views
- Lead generation
Campaign results for LinkedIn brand awareness
When you spend €1000 on a brand awareness campaign on LinkedIn, you can expect to achieve approximately 30,000 impressions among nearly 9,000 people. This means you’ll achieve, on average, just over three impressions per person, which is crucial at this stage because your brand is likely still relatively unknown to your target audience.
Average results of a LinkedIn website traffic campaign
you want to drive clicks to your website, you can expect that with a budget of €1000, you’ll direct approximately 150 people to your website. This is in addition to the over 29,000 impressions among 5,800 people that you achieve with a website traffic campaign.
LinkedIn lead generation: average campaign results
In B2B lead generation, LinkedIn is truly unique. But what can you expect? Based on €1000, you’ll generate an average of 13 leads on LinkedIn. Additionally, you’ll achieve around 23,000 impressions and can reach about 8,000 people with this budget. A crucial point to note is that we almost always use a LinkedIn lead form for lead generation. We deliberately choose not to direct people to a landing page for conversion, as this tends to result in fewer leads in our experience.
Video views on LinkedIn: average campaign results
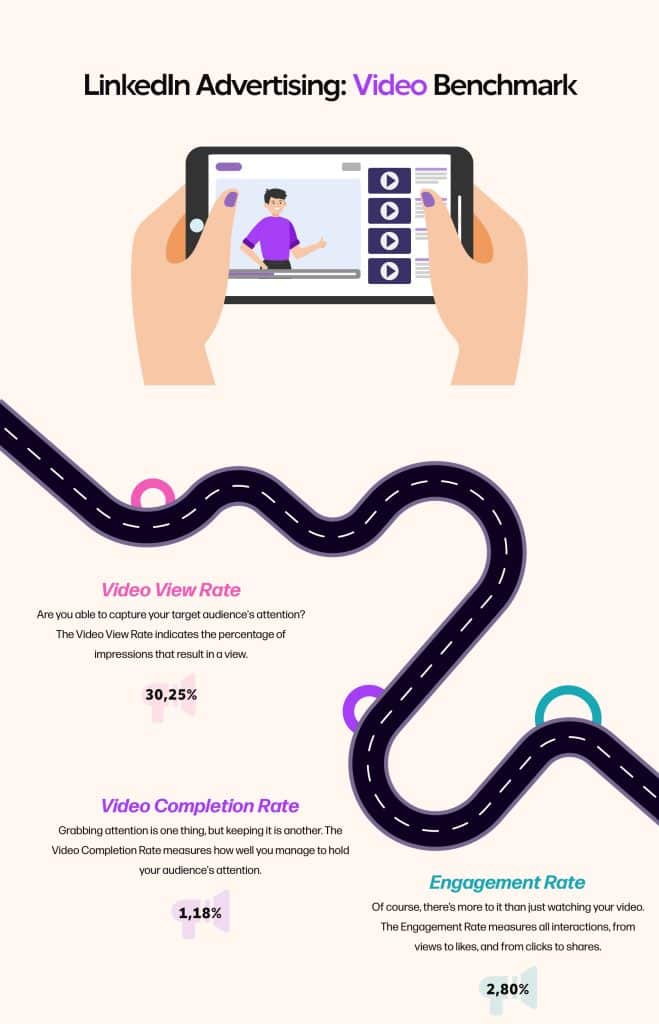
New in our benchmark and a real opportunity on LinkedIn, in our view, are video campaigns. With a budget of €1000, you can expect to achieve nearly 2,000 views in addition to 41,000 impressions among over 11,000 people. It’s worth noting that LinkedIn counts a view when someone watches for more than three seconds, uses fullscreen, or plays the sound of your video. For the best results, we recommend using a short video, up to a maximum of one minute.
Getting started with LinkedIn advertising
In this post, we’ve laid out the hard results of our experience, but not everyone finds these easy to digest. We base these results and best practices on years of experience with LinkedIn advertising for various companies in diverse B2B markets. This is how we help our clients with brand awareness, website visitors, and valuable leads. Would you like to explore the possibilities with us, or do you have a specific question or goal in mind? Get in touch with us, and we’ll discuss the organic and paid opportunities of LinkedIn with you!
Want to read more? We gather all the information on our LinkedIn advertising page.